Category Archives: Projects

Chemistry Stir Plate

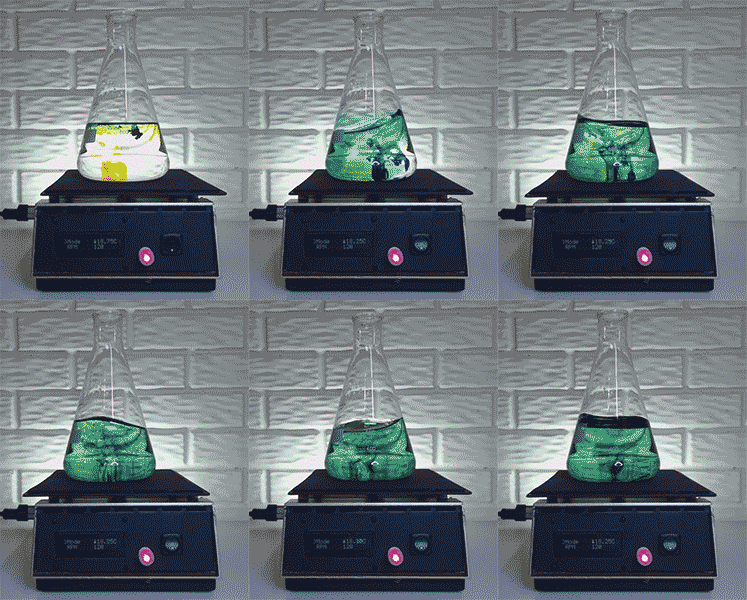
stirAnimation3

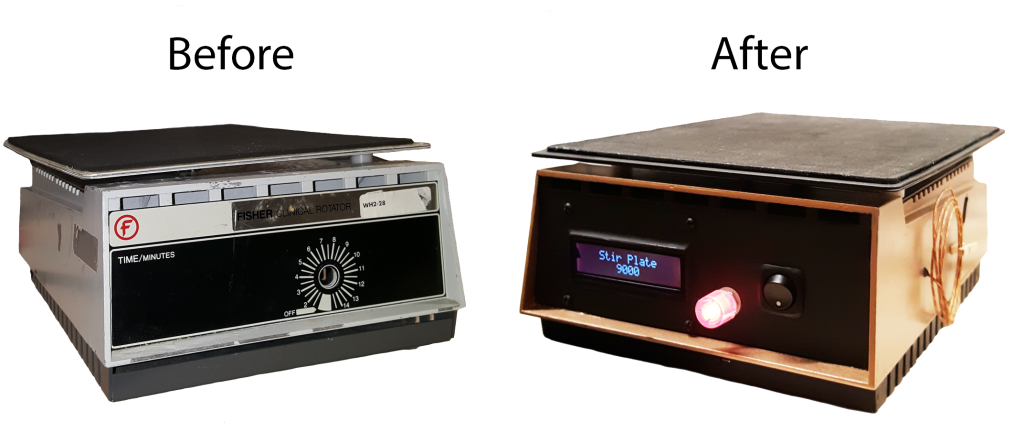
Recently I came across an old chemistry lab stir plate made by Fisher. I thought it would be a fun weekend project to restore it and add some functionality. Here’s a before and after shot of the project.

beforeAfterCompressed

Keep scrolling down if you’re interested in more detail!

In addition to restoring the paint, the features that I added are as follows:

  • Adjustable speed (5 to 150 RPM)
  • Adjustable direction
  • User interface (LCD + Rotary Encoder + Piezo Buzzer)
  • K-Type Thermocouple for temperature readings (-200 to 500°C)
  • Shake mode
  • Stir mode

The microcontroller used in this project is a 16-bit PIC24FJ64GA002.
The C code written for this project can be seen here.

Case

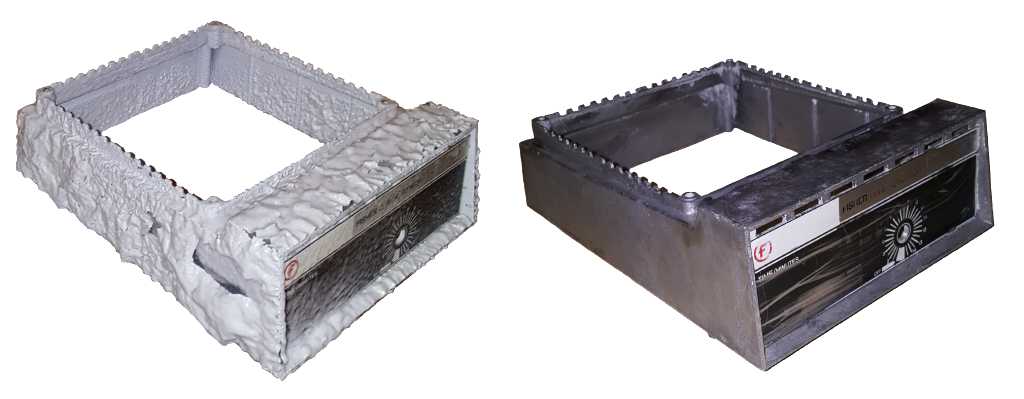
The stripping process:

caseStripping

After the case was clear of old paint and debris, I dremeled out the face plate to make room for the LCD and a switch. I used the hole that was already there for the rotary encoder. Additionally, I cut a port out in the back so that I could add a fused switch for the AC connection.

Finally, I rinsed the case in mineral spirits, applied a primer coat, and then the paint.

Motor

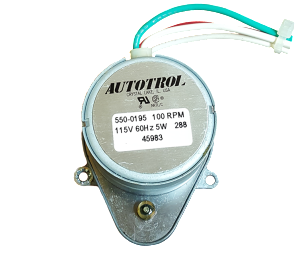
The original motor found in the stir plate is similar to those used to rotate a plate of food in a home microwave. It is an Autotrol permanent magnet synchronous AC gear motor.

autotrolACmotor

These motors can be controlled only by varying the AC’s frequency or by changing their gear ratio, neither of which are cheap or ideal for this application.

The motor that will be used instead is a uni-polar stepper motor.

stepperMotor

I chose to use a stepper motor given that stepper motors are inexpensive and do not require additional feedback components to achieve precise control. This particular stepper motor can provide up to 88.3 N·cm of holding torque which should be more than enough for this application.

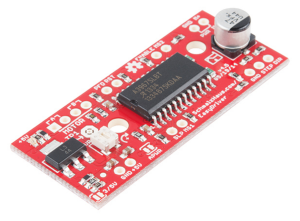
To control the stepper motor, an A3967 Microstepping Stepper Motor Driver will be used. These guys can be easily implemented thanks to  Brian Schmalz’s Easy Driver.

easyDriver

The Easy Driver is supplied with 6-30 volts and can be configured to deliver full steps or micro steps. It is designed to drive bi-polar stepper motors or uni-polar steppers wired as bi-polar. It can supply up to 700 mA to each phase.

A single step is achieved by sending a 3.3 V pulse to the Easy Driver. This particular stepper motor will complete one revolution every 200 steps, so a pulse frequency of 200 Hz correlates to a rotation of 1 revolution per second.

I found that the motor operated much more smoothly when the Easy Driver was configured to operate in micro step mode. Rather than taking a full step each pulse, the stepper motor will take an 8th of a step, or one revolution for every 1600 pulses. This scheme is ideal for microcontrollers that can deliver a pulse width modulation (PWM) signal.

Two factors influence the PWM signal that is generated by the microcontroller: the period (how often a pulse is generated) and the duty cycle (the ratio of high to low within the period).

The period can be controlled using a hardware timer configured as an interrupt source. The period is set by assigning a value to the “period register”.

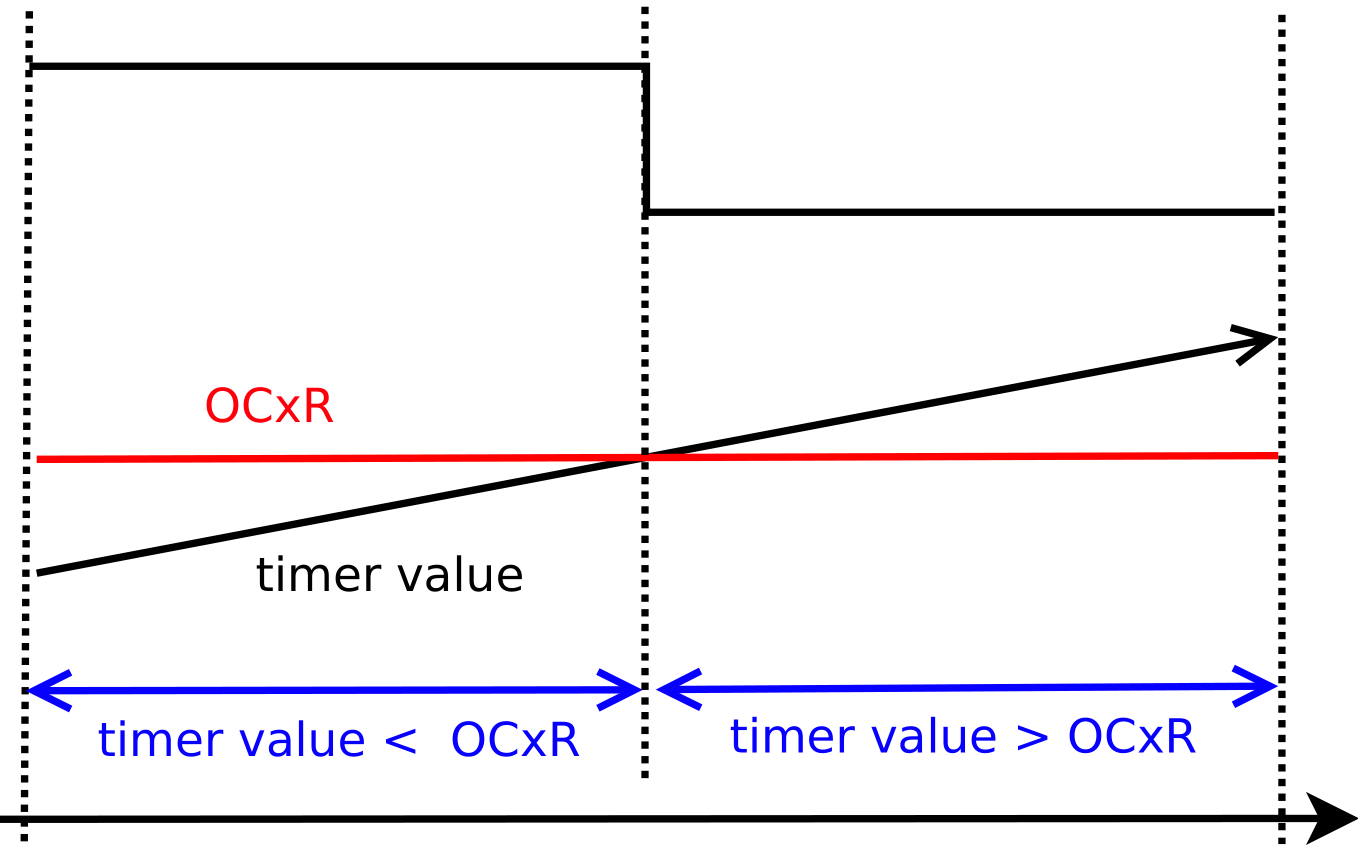
The duty cycle can be controlled by comparing the timer’s value with a threshold value known as the “output compare” value. If the counter’s value is less than the OC value, the designated pin will be driven high, if the counter’s value exceeds the OC value, the pin will be driven low.

outputCompare

By changing the values stored in the period register and the output compare register, the PWM’s frequency and duty cycle can be set. This is what will allow the user to precisely adjust the RPM of the stir plate. The duty cycle will be configured to always remain at 50%.

Power

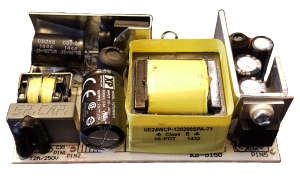
Because stepper motors require direct current, an AC/DC converter will be required. To achieve the necessary DC voltage rails for this project, I will have to convert the 120 VRMS AC coming from the wall to 12 VDC and 3.3 VDC. The 12 VDC will come from a transformer/full-wave bridge rectifier, while the 3.3 VDC will come from a linear LDO regulator that will cascade the rectifier.

psuUncovered

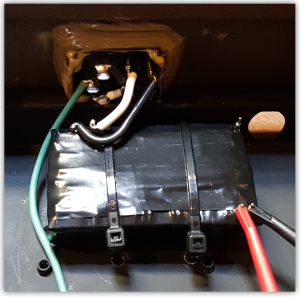
To preserve the AC/DC converter and make it safer, I sealed it in many wrappings of electrical tape. I attached the grounding wire to the case and sanded down all of the contacts to deter current from passing through a human to earth ground in the event that the AC shorts to the case and someone were to touch it.

psuWrapped1

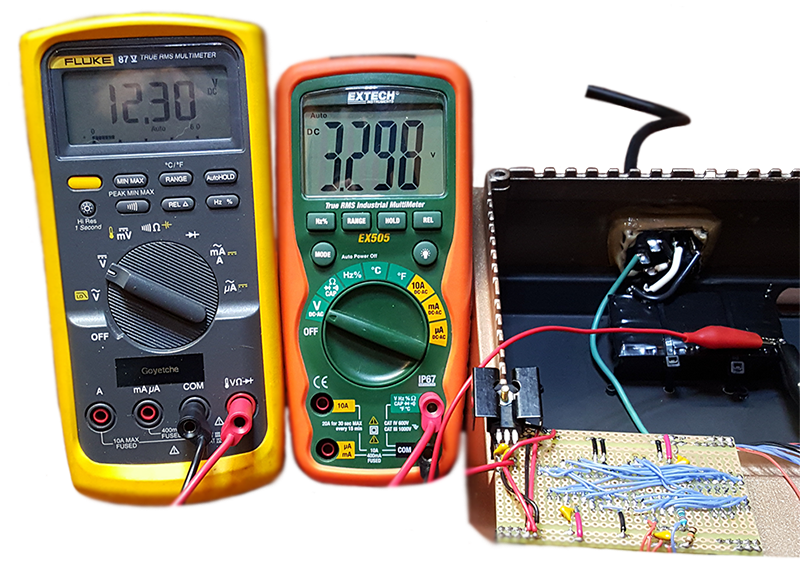
Now to verify the voltage rails…

voltageChecknew

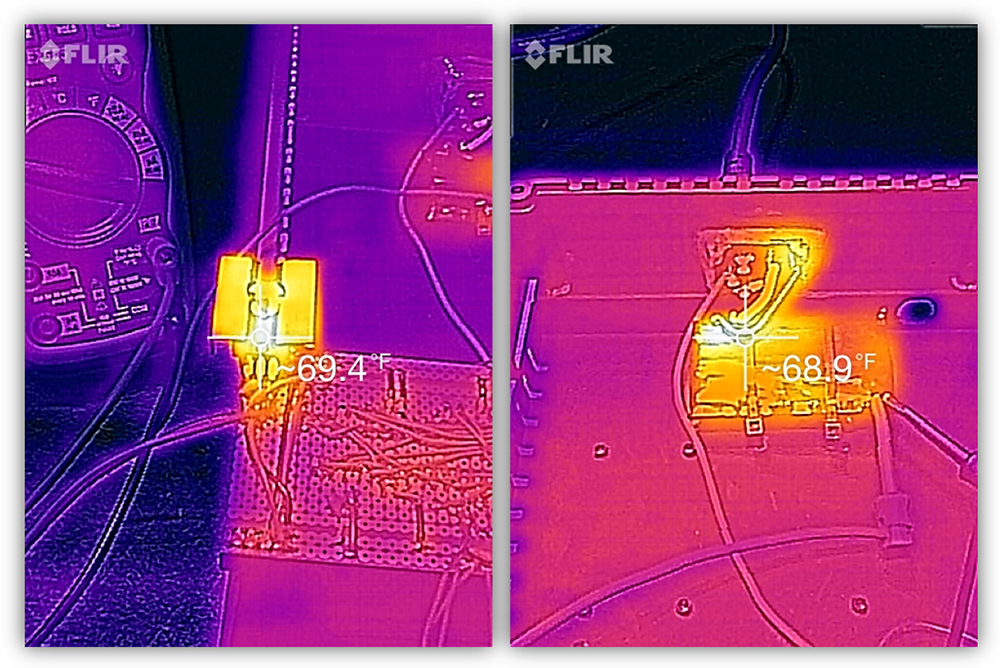
Great! 12.3 V @ 2 A for the stepper motor and 3.3 V @ 500 mA for the logic. The 3.3 V LDO is heat-sinked due to the fact that there is a 9 V voltage drop across it. To further verify that these PSUs are properly installed, I like to be sure there are no thermal issues under load.

psuFLIRcompressed

Looks good.

Control Board

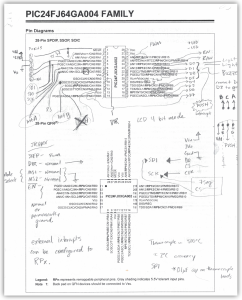
When implementing a controller into a project, I like to start by making a list of the I/O requirements (digital, analog, PWM, communication buses, etc…) and then comparing it to the controller’s datasheet to see if it meets the requirements of the project. In this case, I am just scratching out ideas on the PIC’s pin diagram.

dataSheetScratch

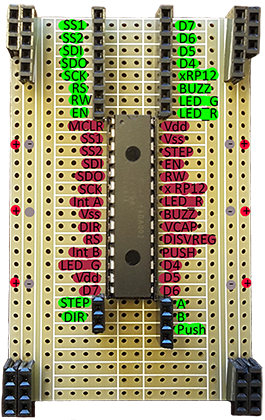
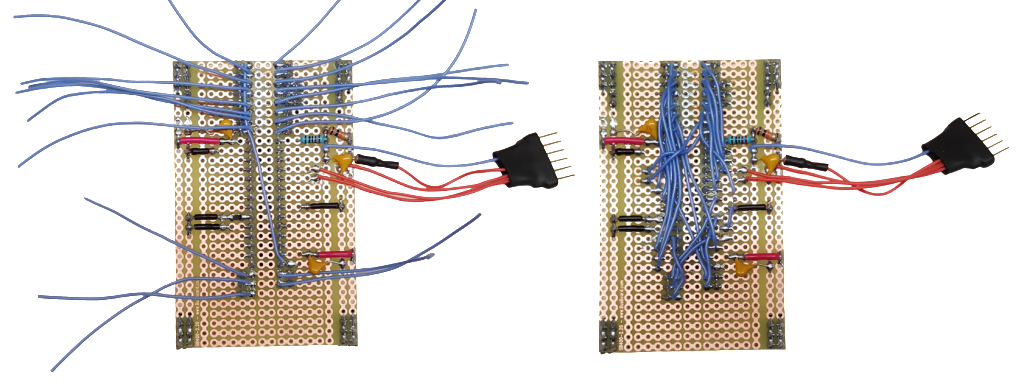
Looks like this will do… now to solder up some proto-board with the basic essentials for the controller. This will be the initial platform for development. To make things easier on myself, I added some female headers and grouped them in order by their function. I then labeled the picture to print out as a reference for wiring.

protoLabelsmall


makingConnections

The proto-board is all wired and ready to begin coding with.

Thermocouple

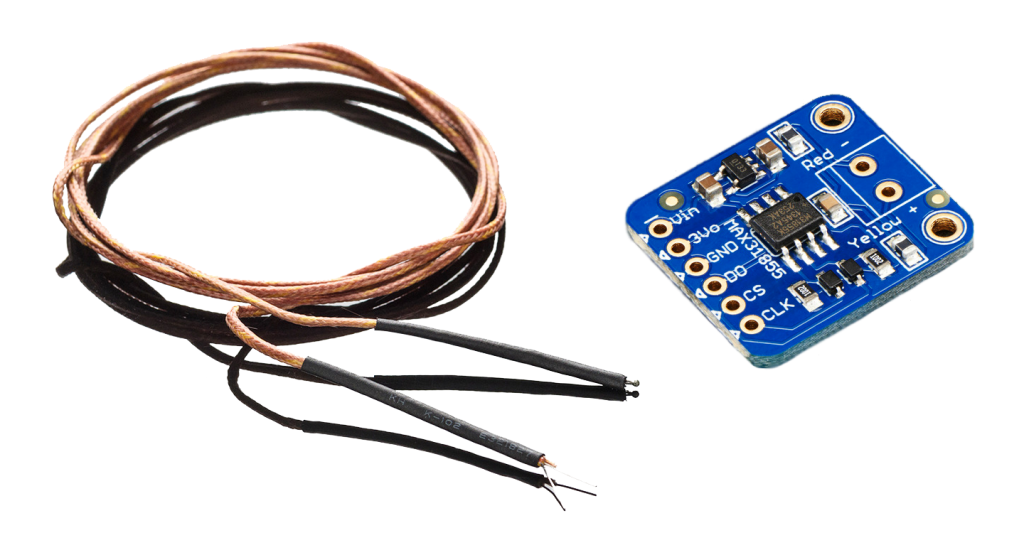
To give the stir plate the ability to measure temperature, I will be adding a K-Type thermocouple with a MAX31855 thermocouple amplifier. This is similar to the thermocouple feature found on some multimeters.

thermo

The thermocouple is made up of two dissimilar metals that are joined at two ends. In the case of this K-Type thermocouple, the alloys are Chromel and Alumel. This arrangement will produce a measurable voltage when there is a difference in temperature between its hot junction (measurement) and cold junction (reference). Because this voltage differential is small, a thermocouple amplifier will be used.

The  MAX31855 will take in the analog voltage from the thermocouple, amplify it, digitize it, and finally encode it. This information is then available via a SPI bus, so the only work I need to do is to write a driver that will grab these bits and decode them for the display.

The protocol is simple. Each time the slave select is pulled low, the temperature data is refreshed. There are 32 bits of information, however, only the 14 most significant bits contain the temperature data, the rest can be dismissed. The MSB is the sign bit, the next 11 bits contain the whole number, and the last 2 bits contain the fractional portion (allowing for increments of 0.25 °C).

For example, if the temperature were -121.5 °C, the data frame of the 14 most significant bits would look like this:

thermoDecode

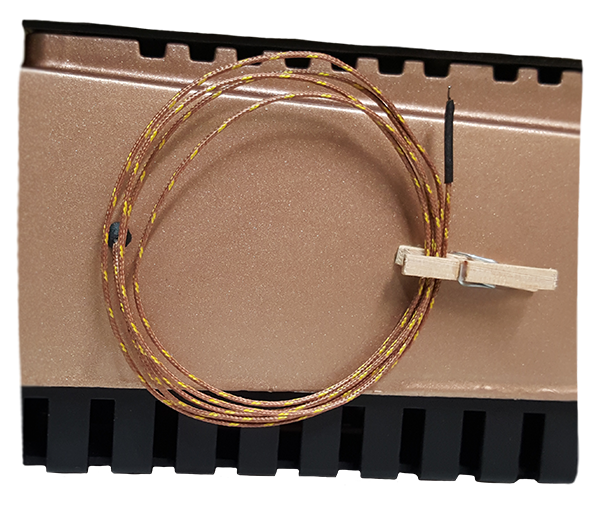
For storage, I added a tiny clothes pin to keep the thermocouple out of the way when it’s not being used.

thermoClip

User Interface

Display

The display that will be used in the user interface is a Hitachi HD44780 LCD. I am going to implement this in 4-bit mode, reducing the data pin requirements from 8 to 4 (this would have been a nightmare without a logic analyzer).

4bitDebug

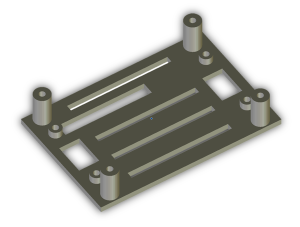
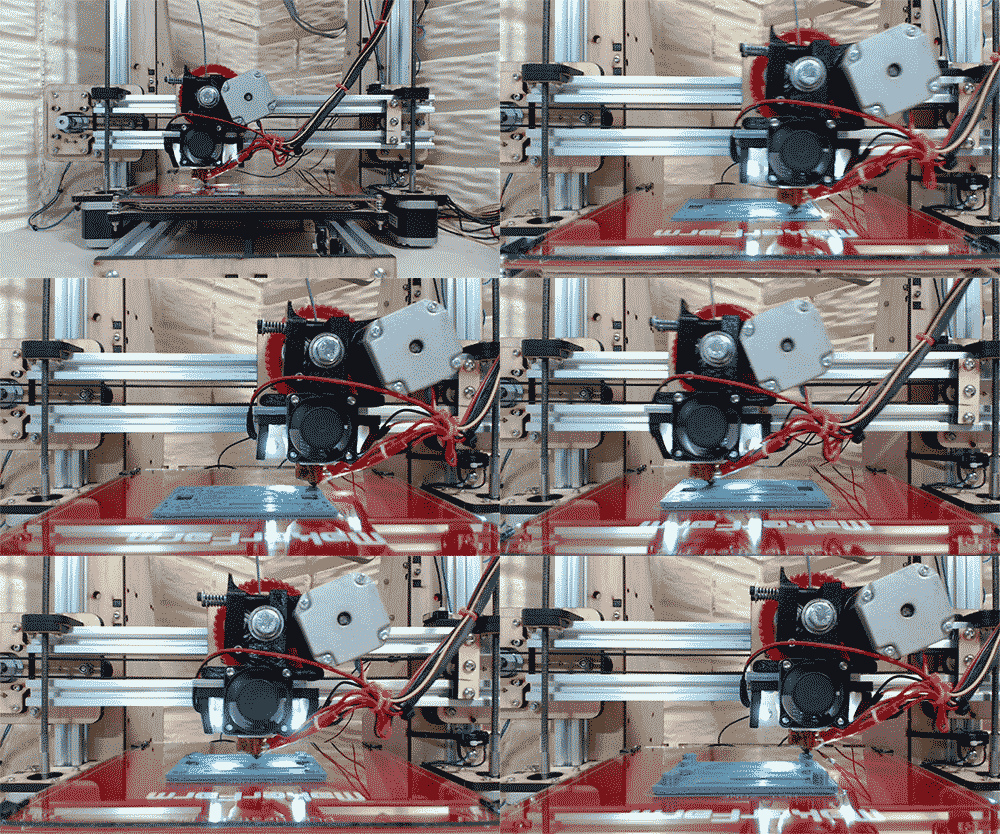
Now to come up with some kind of mounting bracket for the LCD. Here is the 3D model I generated in Blender and then printed on a Prusa i3.

bracketModel2

3dPrint

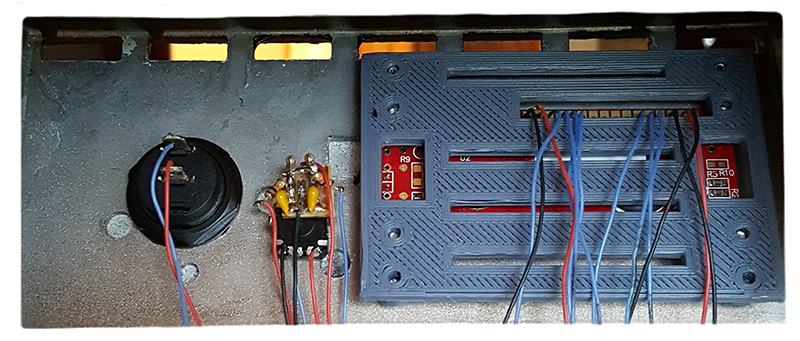
LCD and bracket assembled and wired:

frontBackAssembFinished

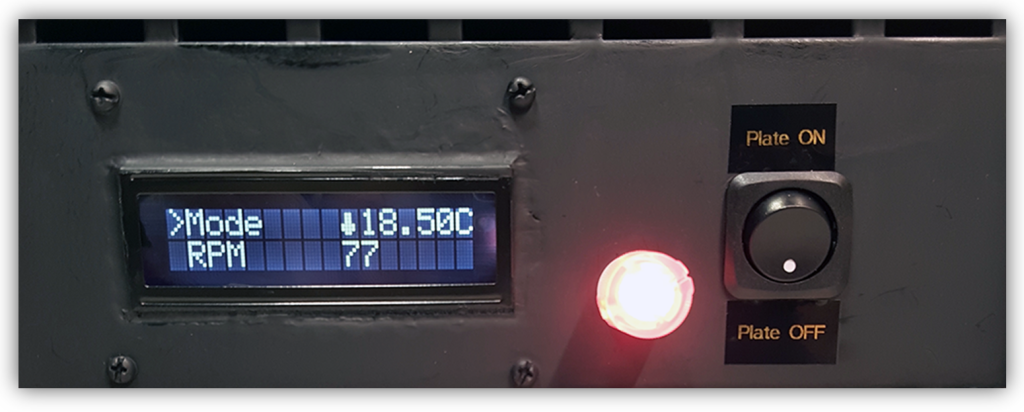
User interface fully assembled and painted:

UI_inside

UIfacePlate

Here are some of the menus that can be navigated to with the rotary encoder. The rotary encoder is interrupt driven, so navigation is seamless even if the microcontroller is busy with another process.

menuScroll

Rotary Encoder

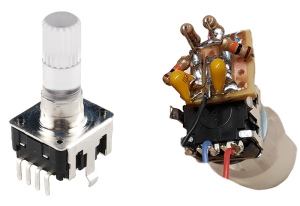
A rotary encoder is essentially a device that consists of two or three switches. There are two switches that are either normally open or normally closed that will briefly change state each time the knob is rotated. The direction of the turn can be deduced by detecting which switch changed state first. The third switch allows the knob itself to act as a momentary push button. This single device can allow a user to scroll through and select different menu options.

rotaryEncoderSidebySide

Because mechanical switching is occurring as the rotary encoder is operated, debouncing each switch with passive low-pass filters will improve its overall function.

Audible Feedback Piezo Buzzer

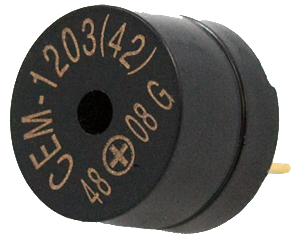
Making an intuitive user interface is a challenge for any designer. It’s easy to navigate through something you designed, but the trick is to always stay in the mindset as if you were looking at it for the first time. Having haptic or audible feedback is a good way to let the user know that their input was received. Although the rotary encoder has distinguishable clicks, a piezo buzzer will generate an audible tone each time an input was successfully received.

piezo


Results

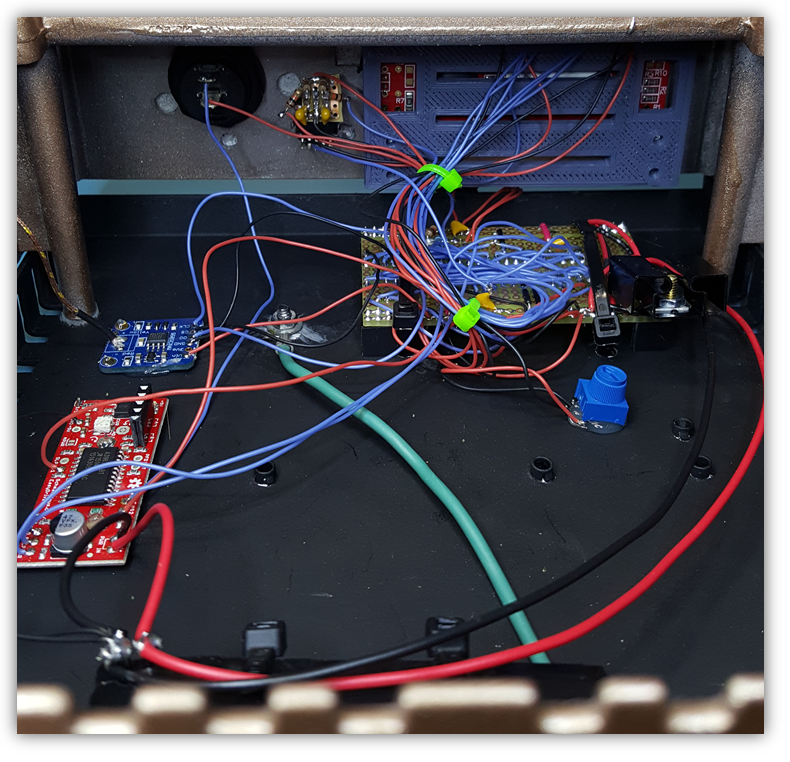
Final wiring:

finalWiring

Finished project:

after

Code
Buy me a coffee!Buy me a coffee!

AC Power Monitoring

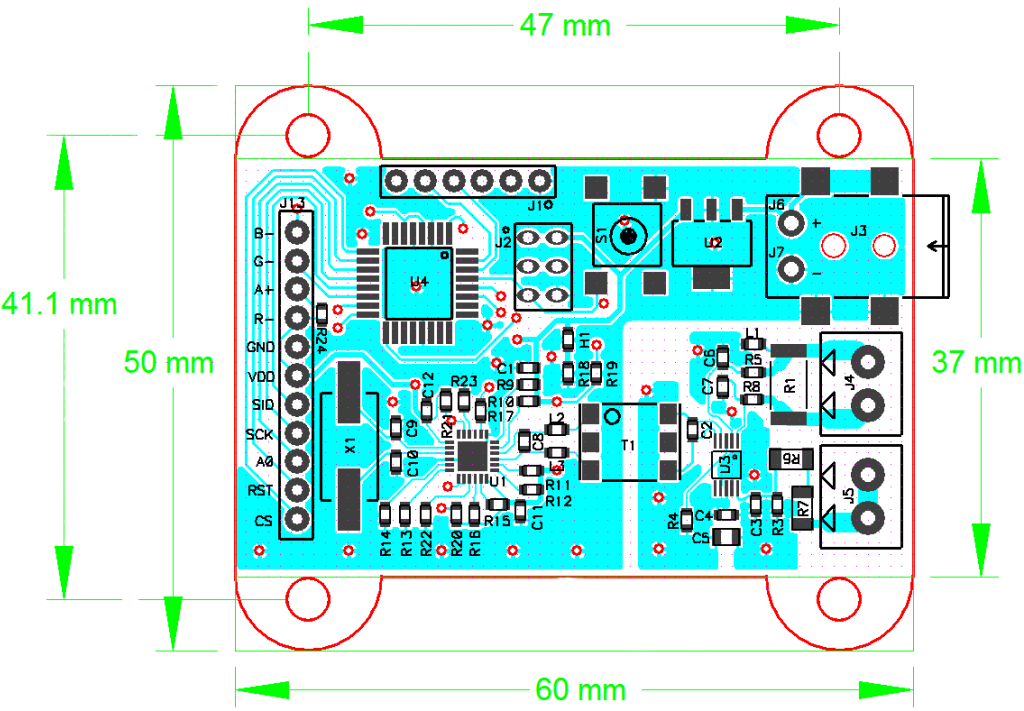
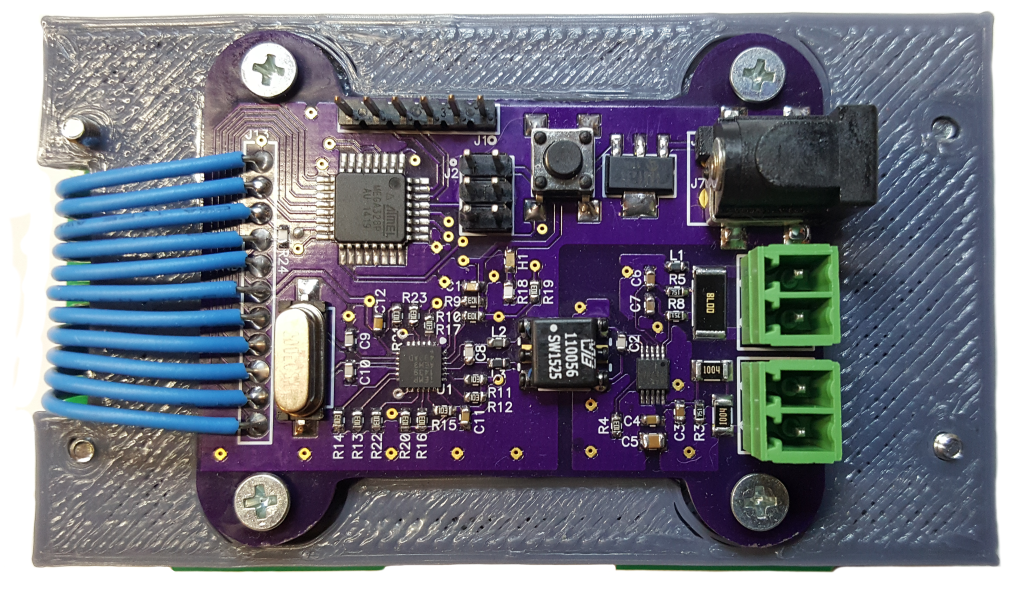
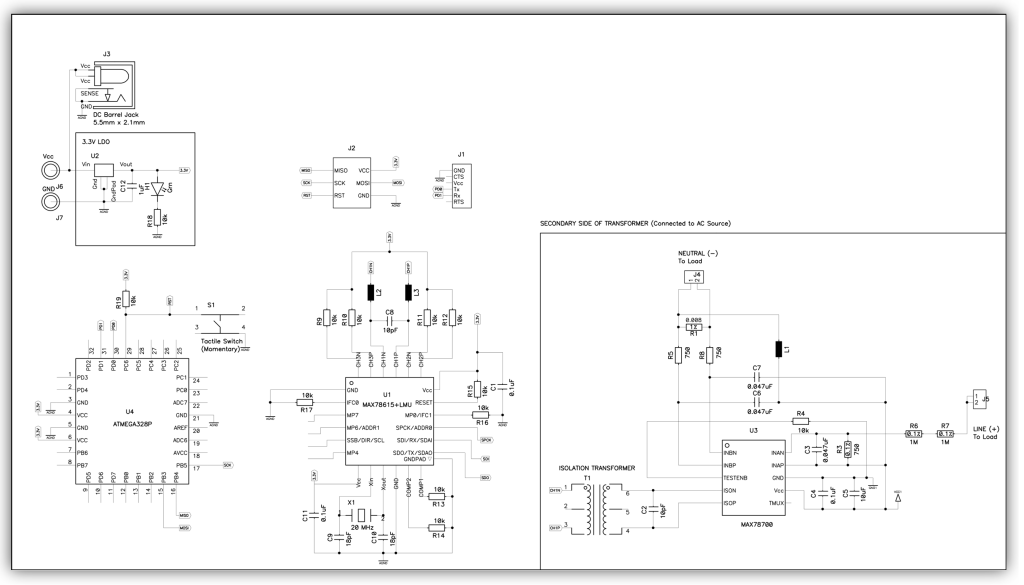
Here is a power monitor I designed featuring the Maxim 78615+LMU isolated energy monitoring IC. In conjunction with the Maxim 78700 analog to digital converter, it has the ability to make isolated power measurements from single or split phase AC with 4 kV of isolation. The transformer couples power to the ADC as well as providing a magnetic coupling for data transmission, allowing the microcontroller to be electrically isolated from the main AC line it is monitoring.

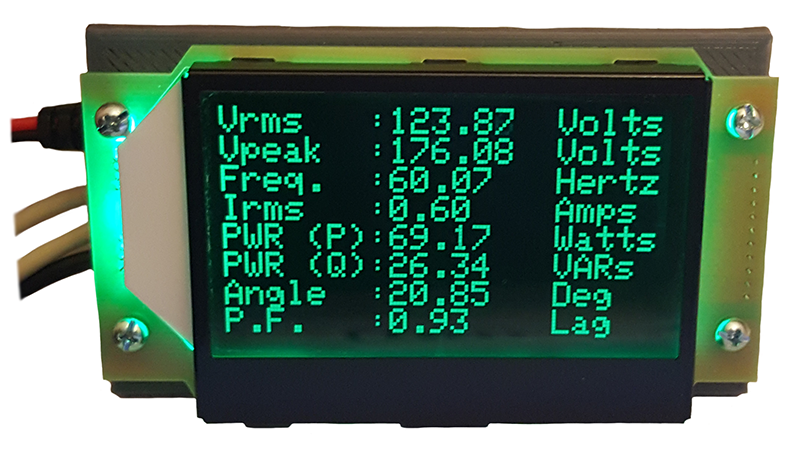
Using a 128×64 LCD, power information can be displayed in real time. Here is the power consumption of my laptop and monitor as I am typing this!

powerMonitor

Board layout:
PowerMonitorInv

powerMon_Back

Schematic:
pmonSch2

Documentation and tutorial coming soon…

Code

Buy me a coffee!Buy me a coffee!

Teeter Totter Pt. 2 (Control)

This is part two of a two part series… check out the construction and characterization of the teeter-totter in part one!

Buy me a coffee!Buy me a coffee!

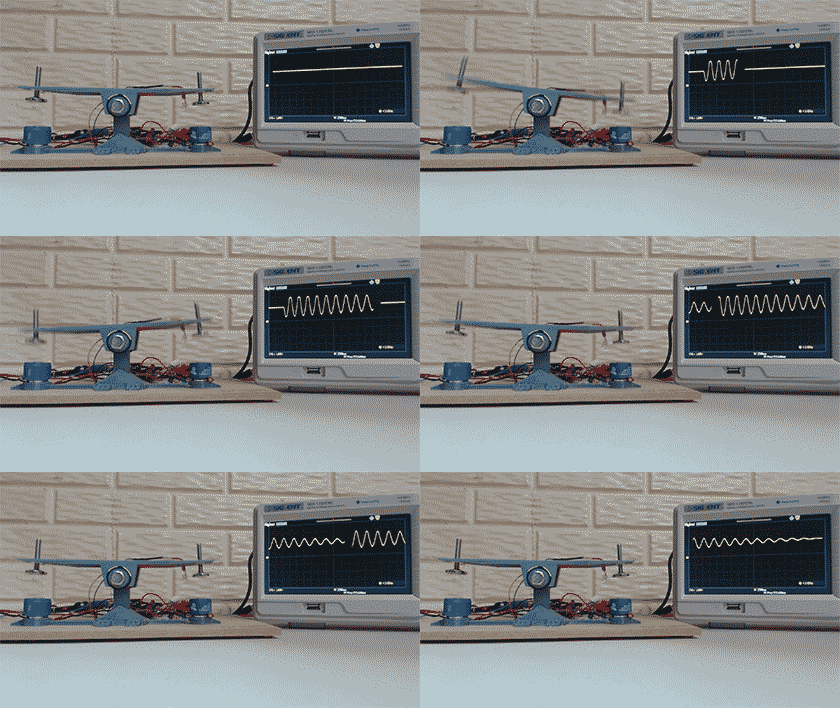
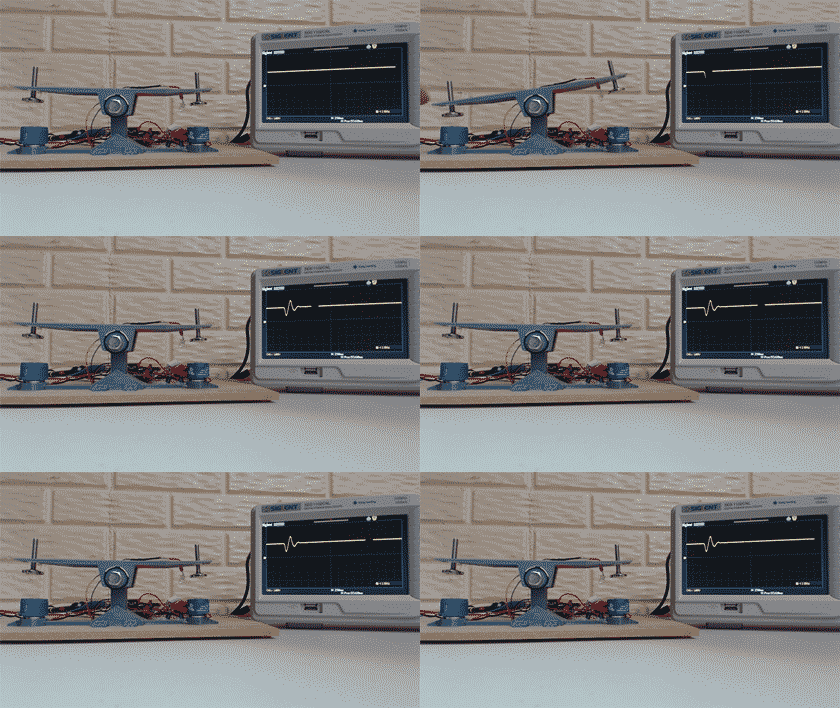
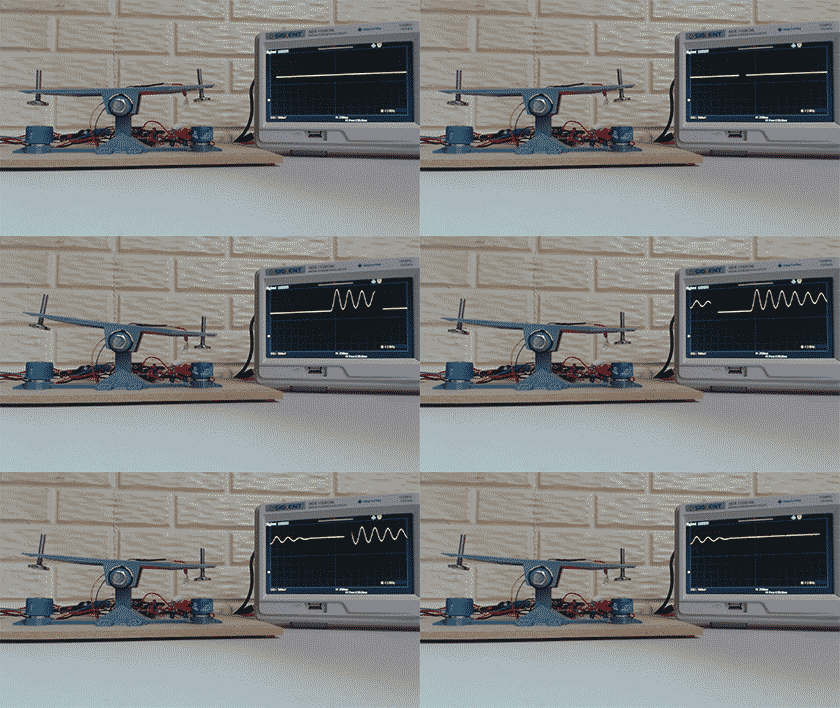
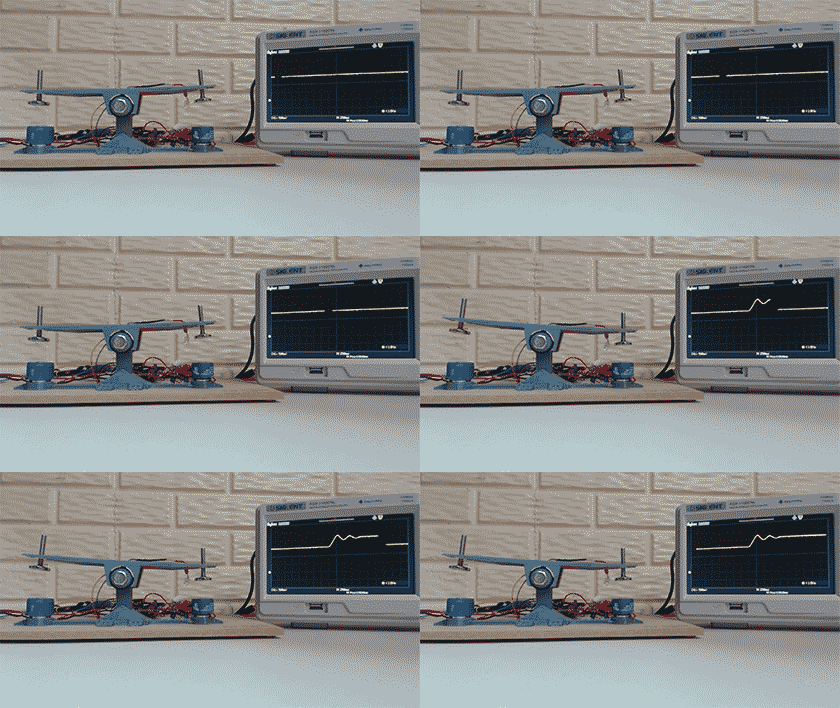
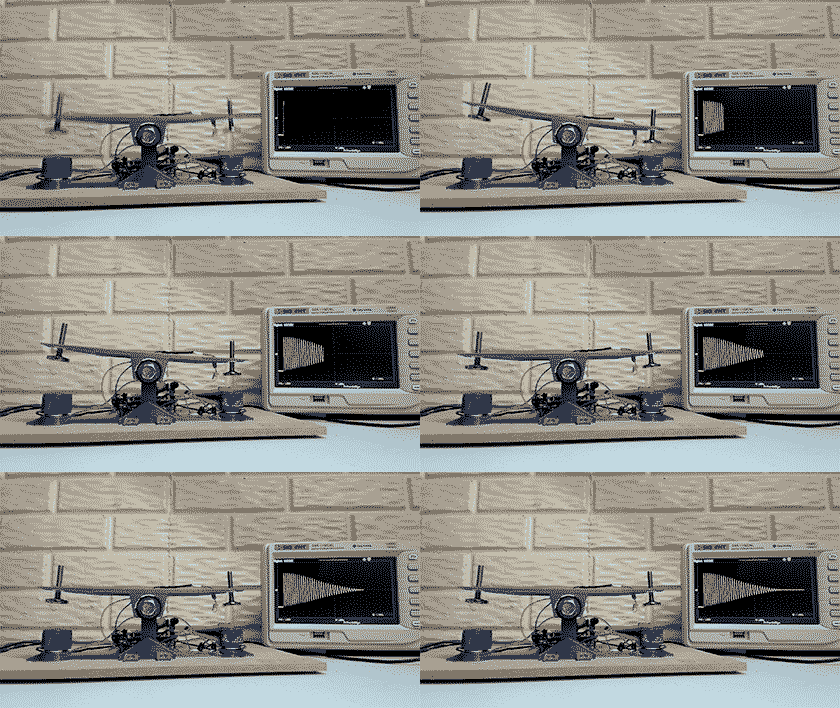
First things first, here are some results. These two GIFs show how a phase lead compensator can significantly improve a system’s ability to recover from outside disturbances. Keep scrolling down if you’re interested in how this was implemented!

Uncompensated impulse response:

UncompImpulse

Compensated impulse response:

ImpulseResp

Abstract – Previously, a teeter-totter was constructed and modeled in the continuous time domain. This model will be brought into the z-domain so that it can be controlled by a sampled data discrete time control system. A NI Data Acquisition Tool as well as an ARM Cortex-M4 will be used to implement the control schemes.

The first control system to be implemented is the open loop controller, allowing the system to reach a reference point with minimal overshoot and settling time, but still remaining vulnerable to disturbances.

To reject disturbances, a closed loop lead compensator will be implemented, allowing for rejection of disturbances, but contributing notable steady state error.

To get the best of both worlds, the lead compensator will be combined with the open loop controller to create a “Bridged-T” network. This will allow for low steady state error due to the open loop controller and rejection to disturbances due to the lead compensator. This control system will be implemented on an ARM Cortex M4 microprocessor rather than the NI-Data Acquisition tool used for the phase lead compensator.

The z-domain

Previously, a continuous time domain transfer function for the teeter-totter was arrived at by means of impulse response.

01

To bring this continuous time s-domain transfer function into the z-domain, the z-transform must be applied.

02

This z-domain model now takes into account a sample time of 18 ms  and the zeroth-order hold to account for the data acquisition instruments.

03

Open Loop Control

Open loop control can be a desirable means of control for certain applications where disturbance rejection is not necessary. Additionally, open loop controllers can be applied in series with other methods of feedback control when it is desirable to reject disturbances to the plant. Open loop control is easy to implement and can allow a system to adjust to a reference point with little overshoot or steady state error, if any at all.

The following figure illustrates the implementation of an open loop controller F(z)

04_ctrlsPt2

It can be seen that F(z) is a volt-to-volt transfer function, which explains the constant of 1/Ka  out front. This allows the input to the system to be a reference position. The inverse of the actuator gain is used rather than the sensor gain due to the nature of the open loop system. Because there is no feedback present, it would be nonsensical to use sensor gain. Note the hat above Ka designating the experimentally determined numerical value that is a model of the true behavior of Ka.

The implementation of an open loop controller is simple. The idea is to create a transfer function based on the current (undesired) pole locations of the plant transfer function G(z), and the desired pole locations. By placing the undesired (actual) G(z) pole locations in F(z)’s numerator, they will effectively “cancel” out the undesirable poles. With that being said, the poles will never truly cancel out even though they may appear to be canceling mathematically. Finally, F(z)’s denominator is set to be the desired pole locations.

F(z)’s denominator can be anything, but the idea is to force the system to behave in a desirable way. Ideally, the poles of G(z) would be repeated on the positive real axis, as close to the imaginary axis as possible. It is likely that this will not be achievable, as it will require more actuator energy than what is available. It is for this reason that a happy medium must be arrived at, where the desired behavior is in harmony with the system and its resources.

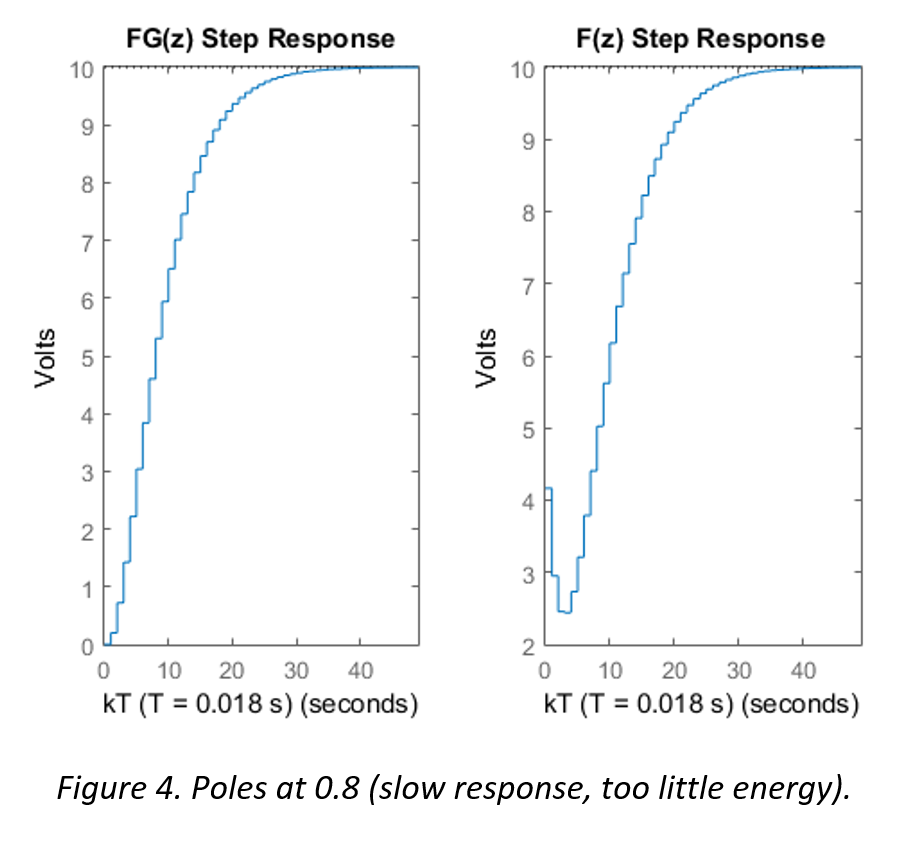
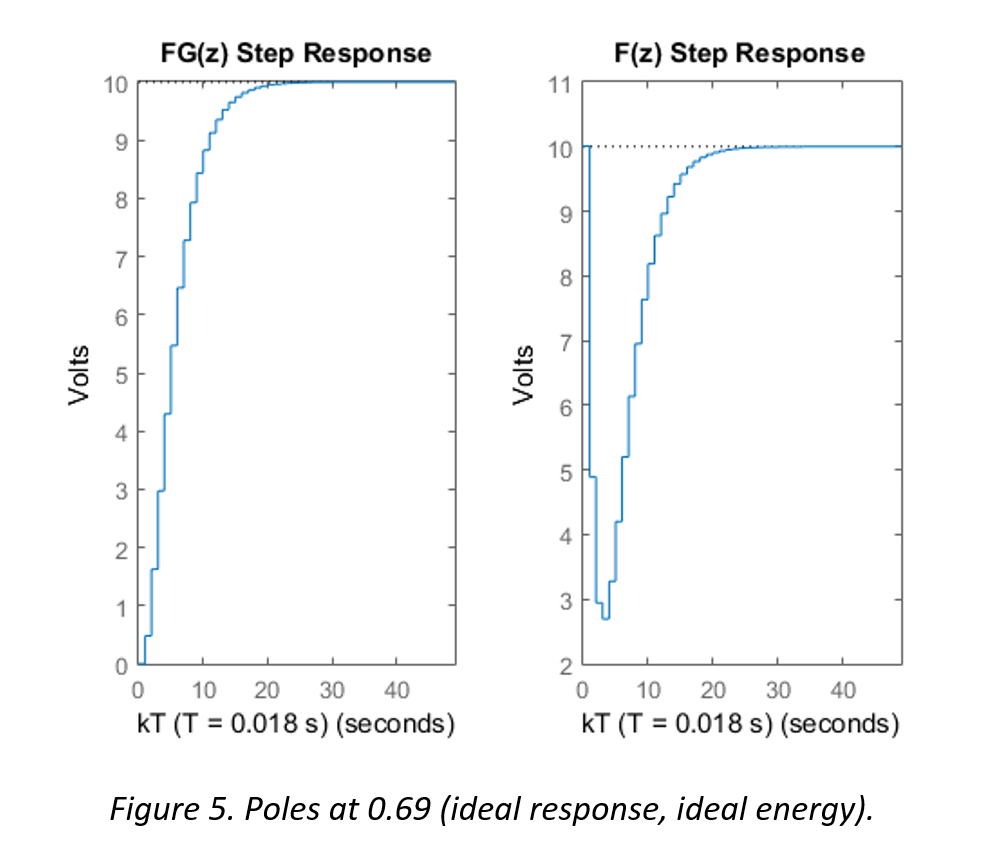
The following three figures illustrate the step response of the system FG(z) and the controller F(z)

05_ctrlsPt2

The simulation in Figure 3 shows the most ideal response characteristics, however, it would require an initial burst of over 100 V, which would exceed the limitations of the voltage supply and actuators.

06_ctrlsPt2

The simulation in Figure 4 shows a response which requires little energy, and it can be seen that the system takes a significantly longer amount of time to reach steady state when compared to the response time in Figure 3.

07_ctrlsPt2

The simulation in Figure 5 shows the ideal balance between response time and energy requirements. The initial “push” does not exceed the limitations of the actuators or the supply, and the amount of time to settle at steady state is reasonable (approximately half of a second).

Therefore, the transfer function of F(z) is set to be

08_ctrlsPt2

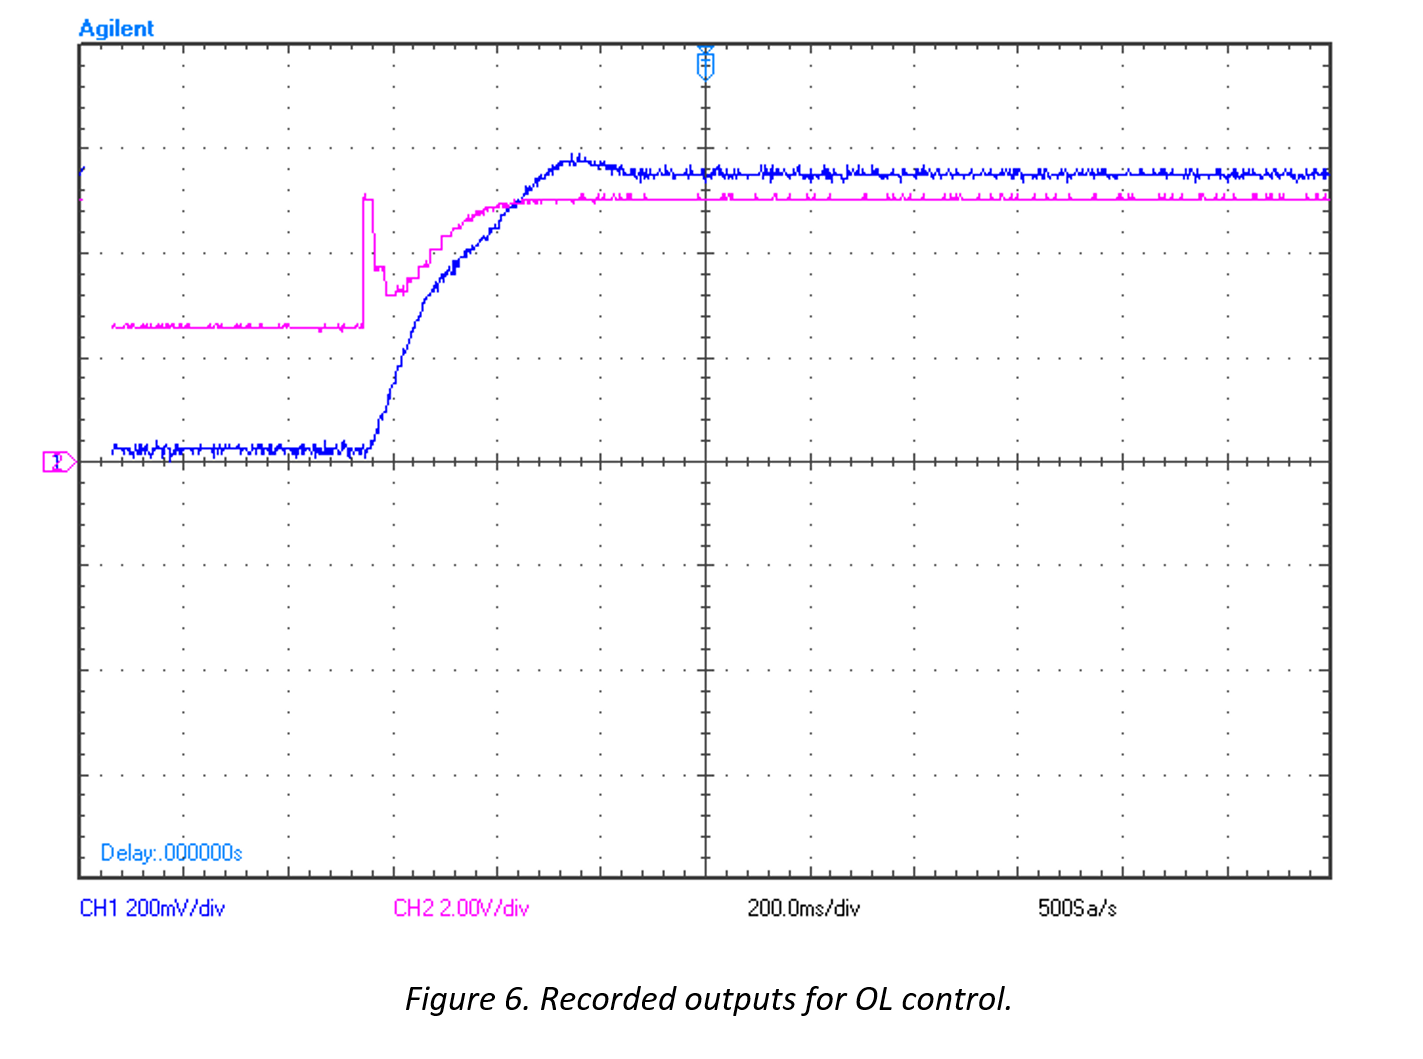
The actual outputs of FG(z) and G(z) can be seen in the following figure

09_ctrlsPt2

The pink line illustrates F(z)’s output, where it is coming from a DAC whose dynamic range is 0 to 5 volts. The blue line illustrates FG(z)’s output. Note the slight overshoot and settling time of approximately 0.5 seconds.

Uncompensated step response:

StepUncomp

Compensated step response:

StepResp

These GIFs demonstrate the reduction in settling time due to the open loop controller when the system is given the command to move to a new reference point.

Lead Compensation

Lead compensation is a type of compensation which improves the loop phase at the expense of the loop gain. Lead compensation is desirable in that it can be used to first stabilize the system with an acceptable phase margin before attempting to improve its performance. Lead compensators tend to speed up the transient response but will increase the steady state error. Additionally, lead compensation can increase system bandwidth and stability margins, and for this reason, is essential to systems that are unstable or on the border of instability.

The following figure illustrates the implementation of an lead compensator D(z)

10_ctrlsPt2

Because D(z) is a volt-to-volt transfer function, the Ks hat term must be applied to the input reference. The hat on Ks denotes that it is a model of the sensor gain, not the physical gain exhibited by the sensor which is found in the feedback loop.

The approach for implementing a lead compensator can be done in either the time or frequency domain. The idea is to satisfy the specifications on phase margin, gain crossover frequency, and steady state accuracy. To achieve this, a Bode plot of the plant is constructed and the phase curve is adjusted in such a way that the phase margin and gain crossover frequency requirements are met.

A phase lead compensator consists of a single pole and zero. Its transfer function can be described as

11_ctrlsPt2

Where a pole exists at z = 0 and a zero exists such that a < 1.

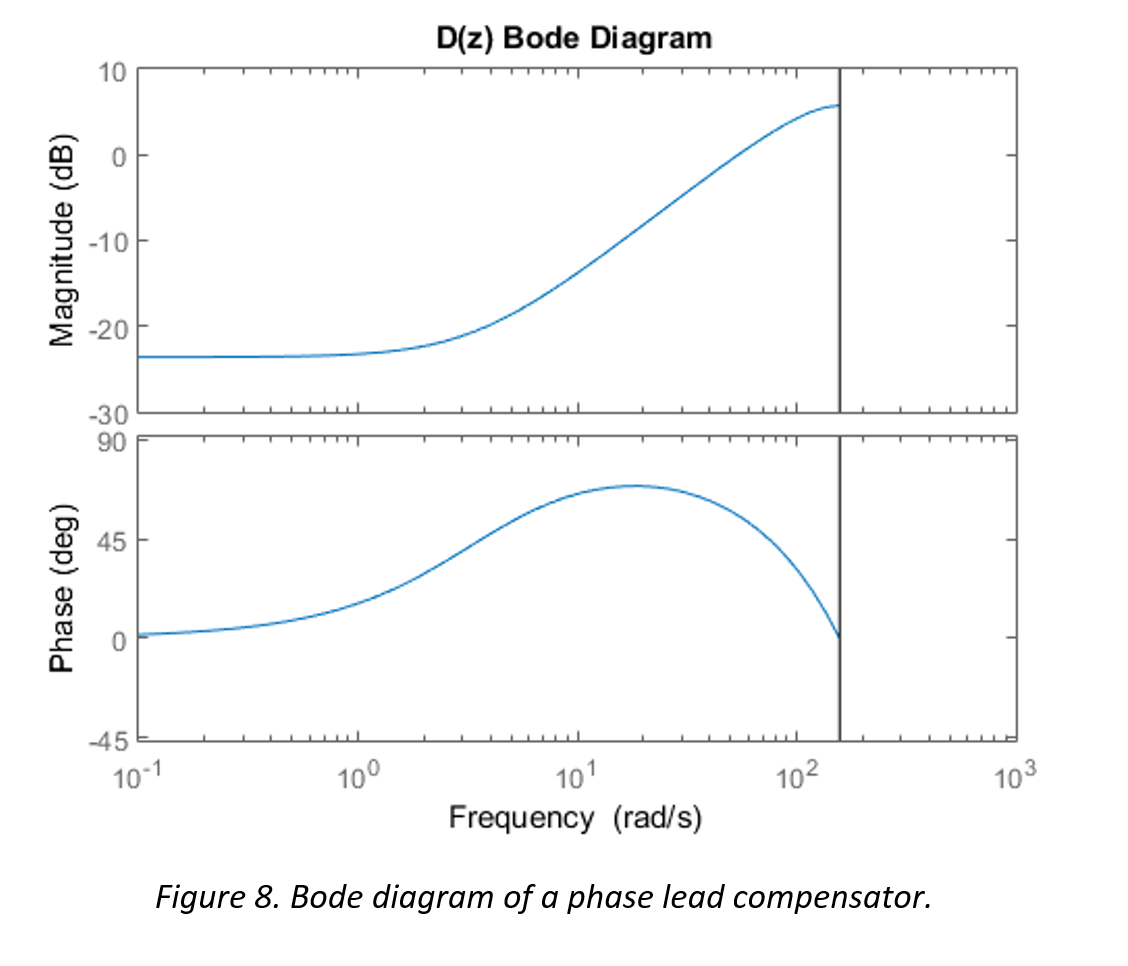
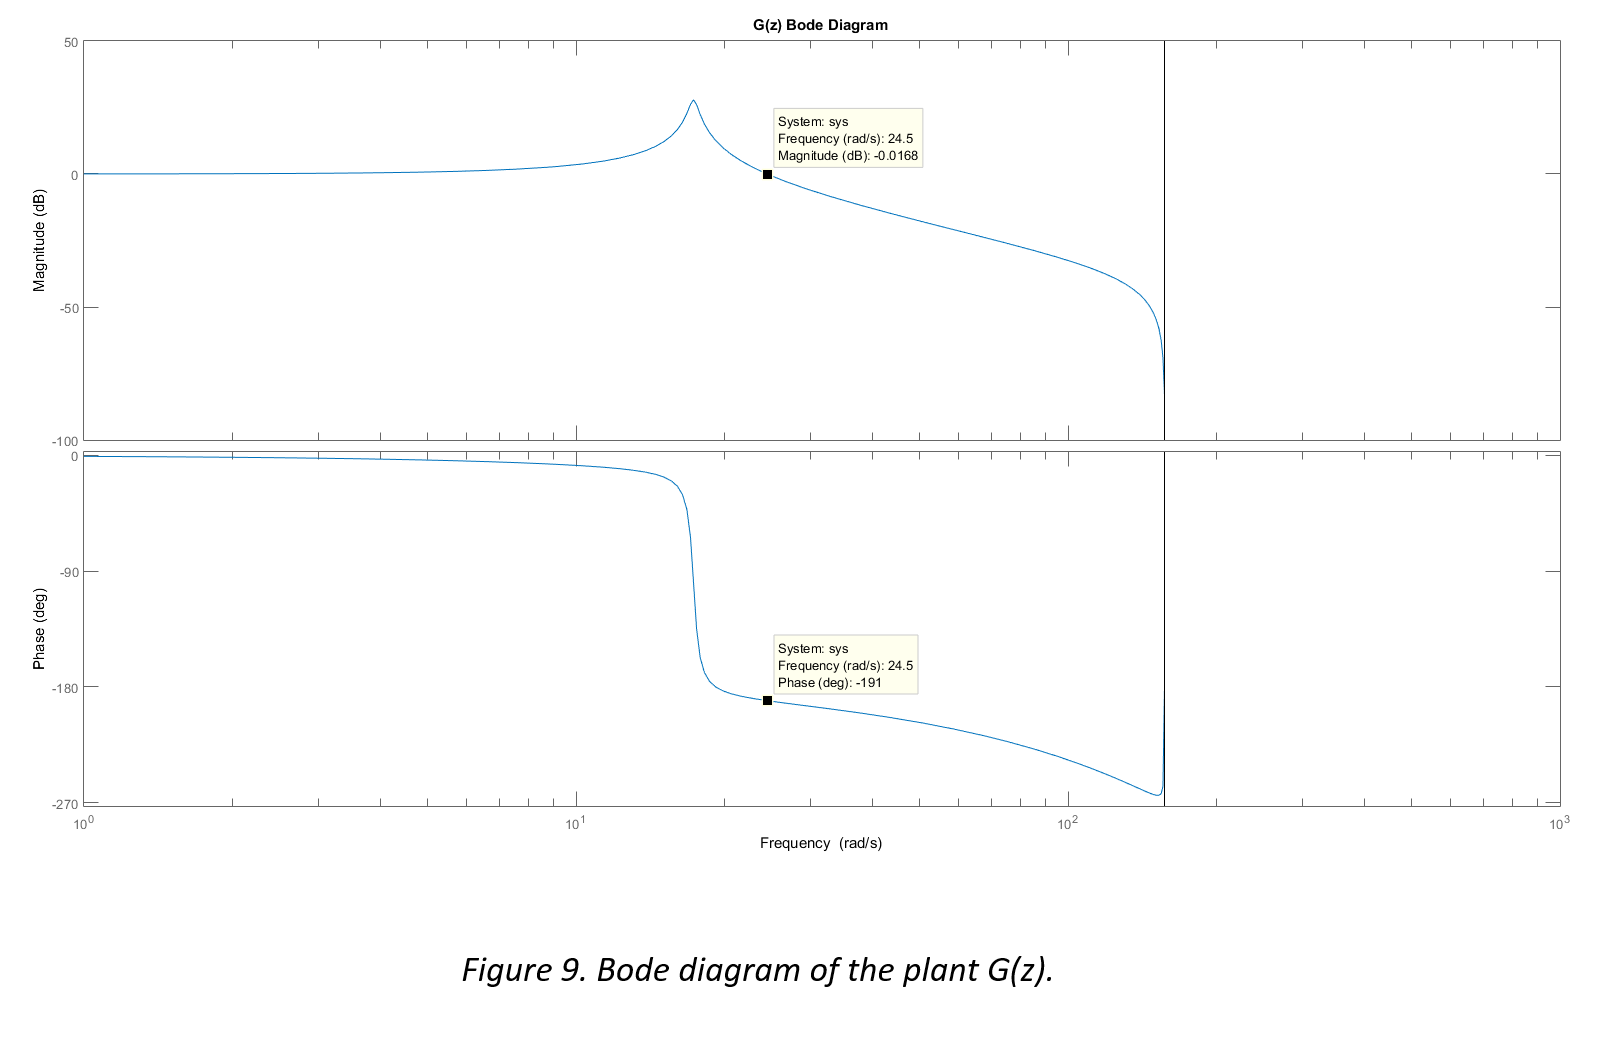
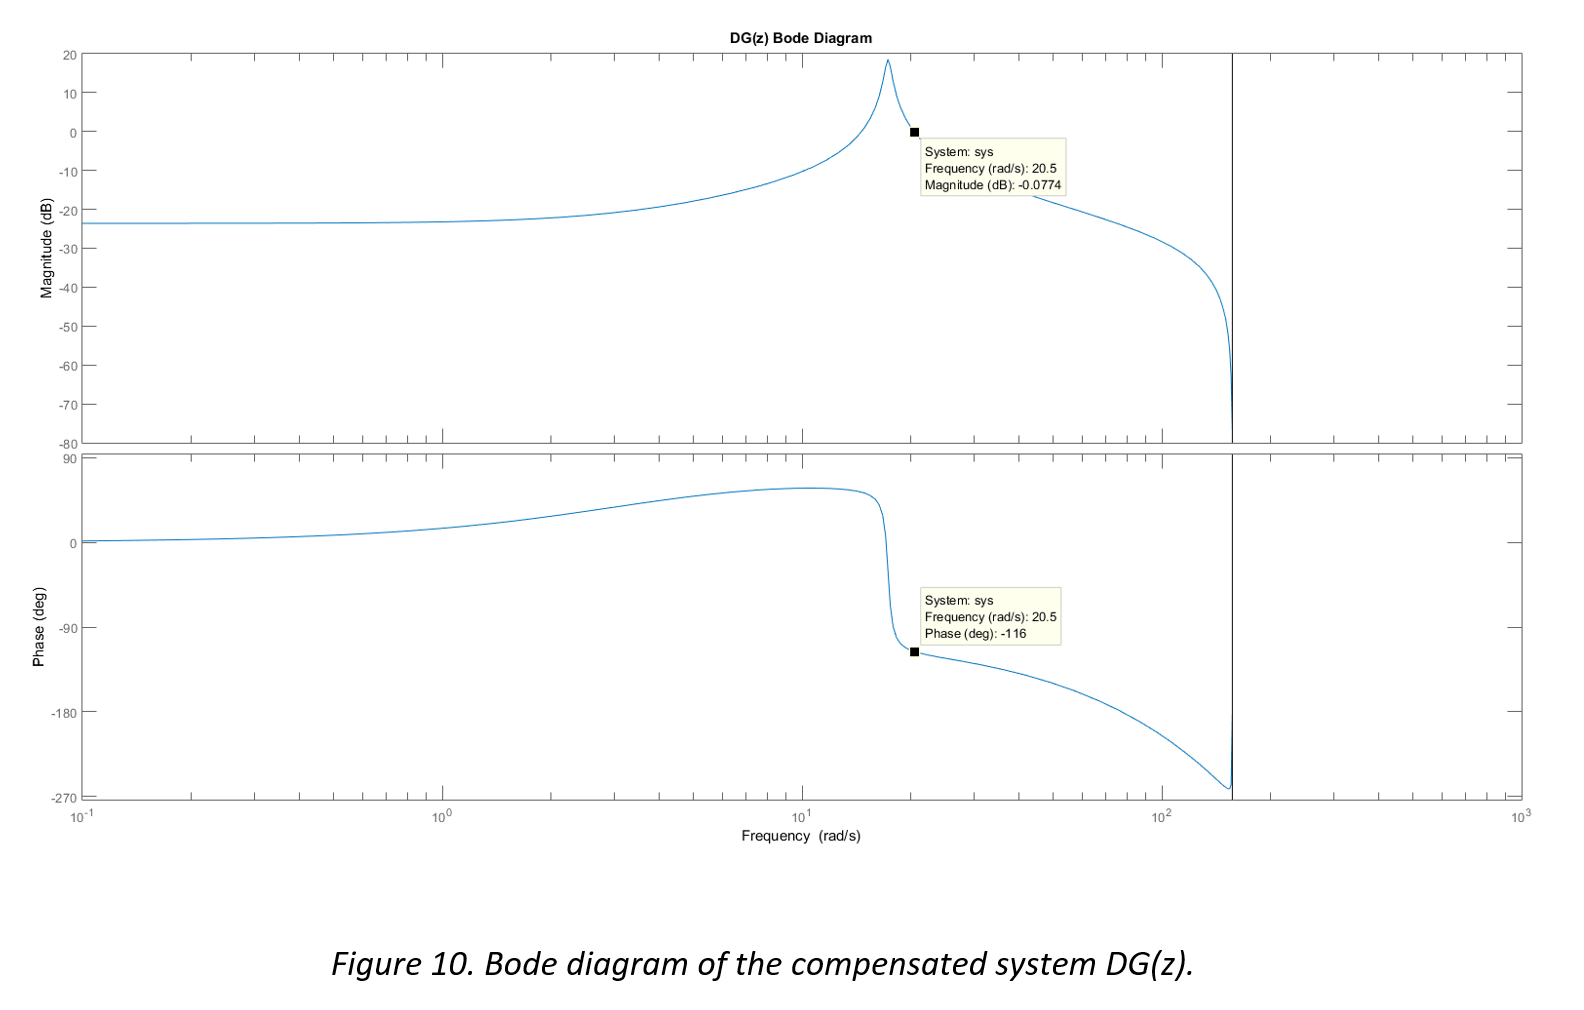
In order to properly implement a phase lead compensator, the pole and zero must be placed in a manner that the benefits of the positive phase shift are achieved and the magnitude degradation is accounted for. The following figures illustrate the magnitude and phase frequency characteristics of a phase lead compensator D(z), the plant G(z), and the combined system DG(z).

12_ctrlsPt2

13_ctrlsPt2

14_ctrlsPt2

It can be seen in Figure 9 that the plant is unstable at the zero crossover frequency (the phase is less than -180°). Figure 8 illustrates a lead compensator which exhibits the phase lead required to stabilize the system, along with the undesirable but necessary degradation to the gain at lower frequencies. Figure 10 shows the combined result DG(z), where the system is now stable with approximately 65° of phase margin at the gain crossover frequency.

The transfer function for the lead compensator which resulted in these stability improvements is

15_ctrlsPt2

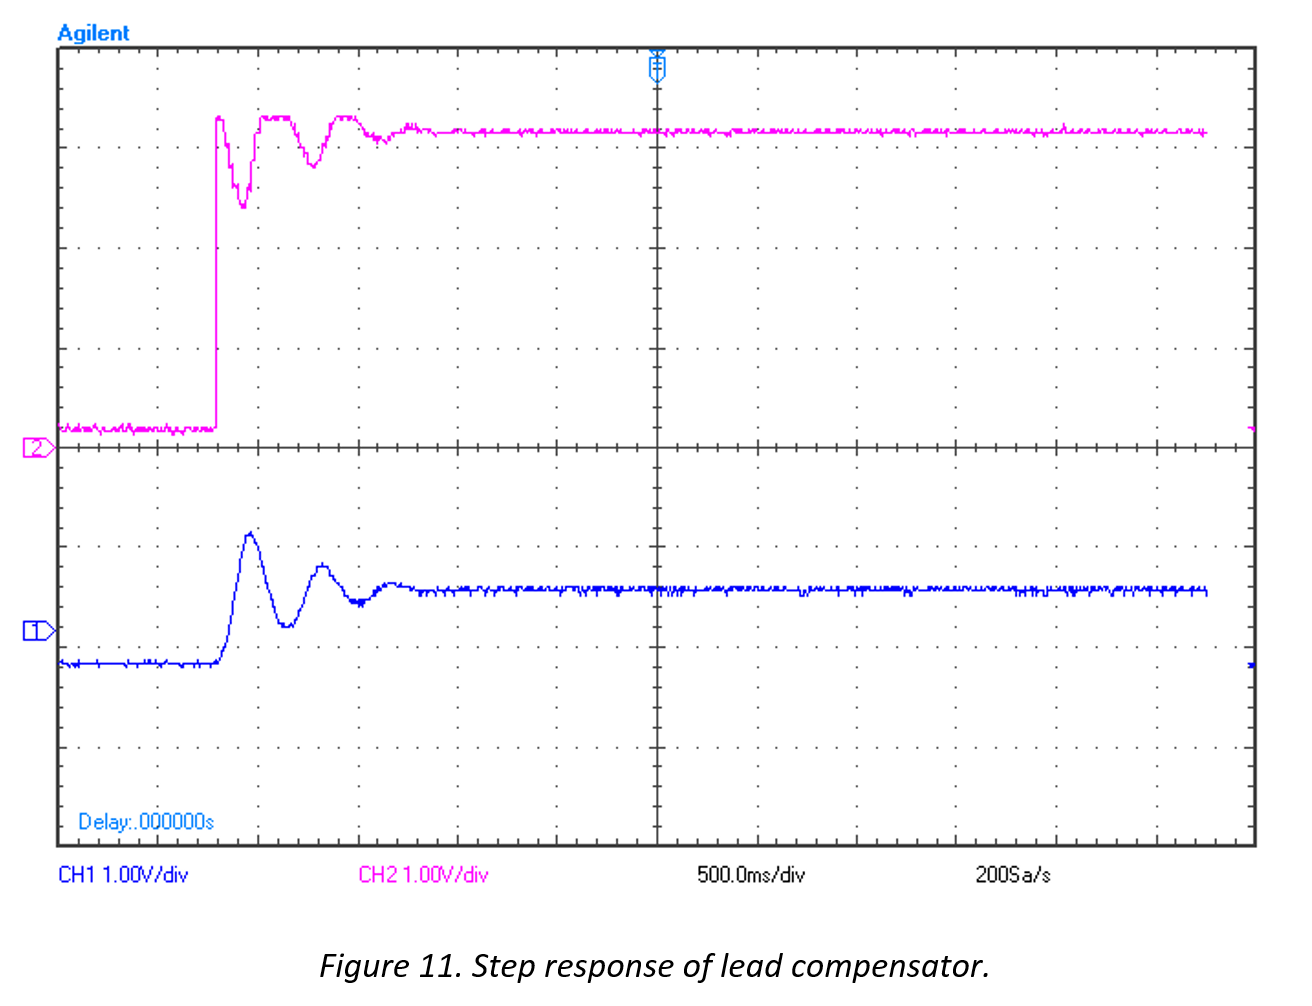
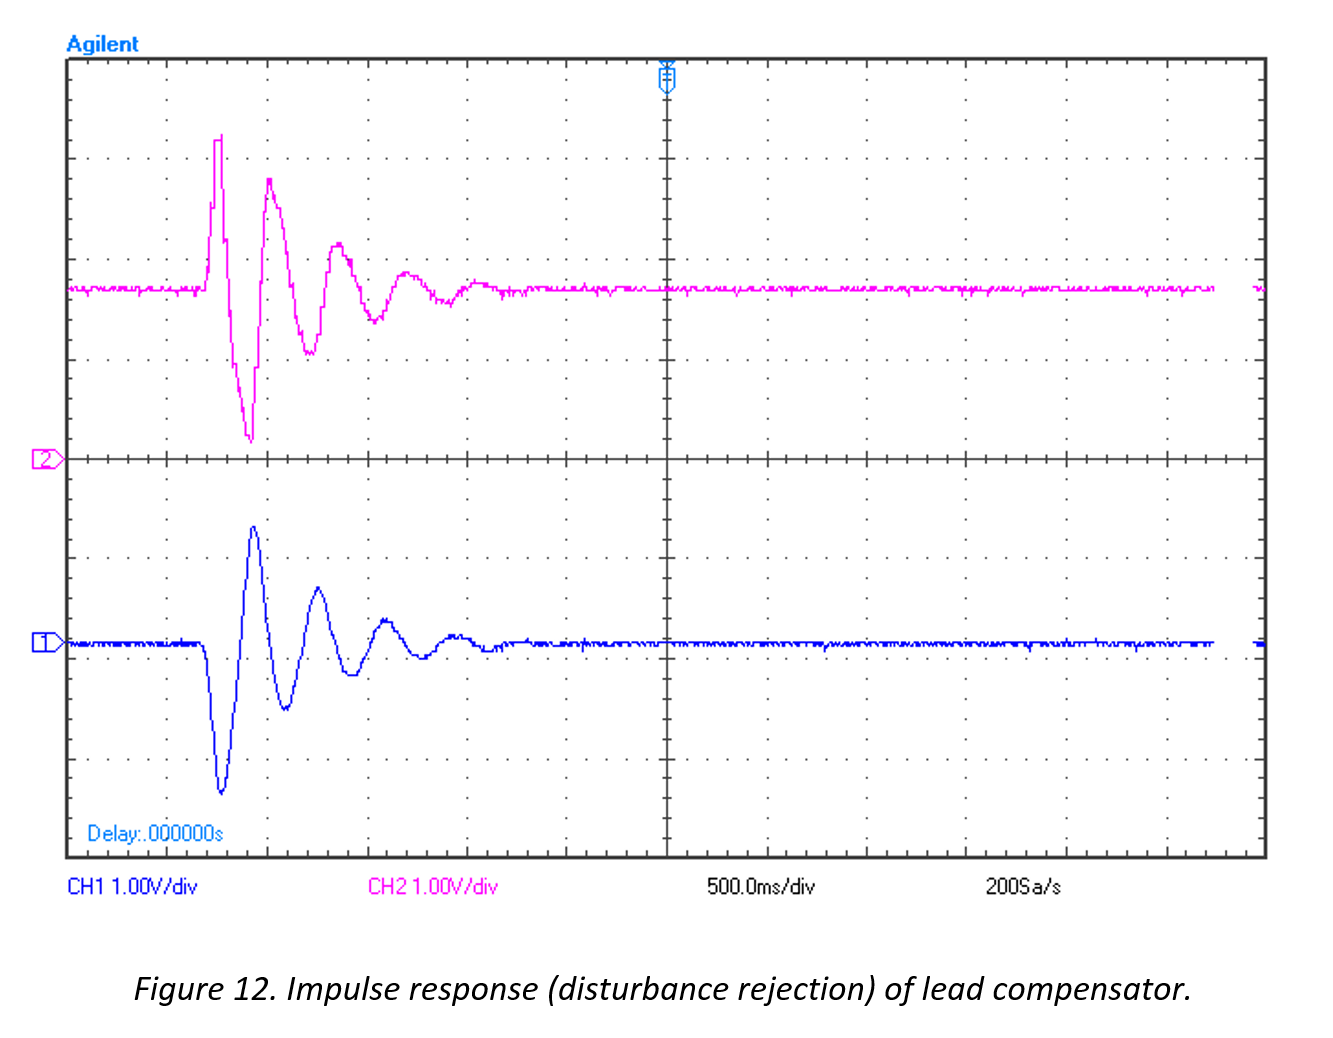
The phase lead controller was implemented in a manner illustrated by Figure 7. The resulting controller and system outputs can be seen in the following figures.

Note that the system now has the ability to be adjusted to a reference point with some undesired transient characteristics and steady state error (Figure 11), but can respond to impulse responses and reject disturbances (Figure 12).

16_ctrlsPt2

17_ctrlsPt2

Note that the blue illustrates the system output and the pink illustrates the DAC output to the actuators.

Figure 12 shows a settling time improvement by a factor of 8. The system settles in approximately 1.5 seconds due to an impulse response, compared to the uncompensated system which settled in approximately 12 seconds.

Bridged-T Controller

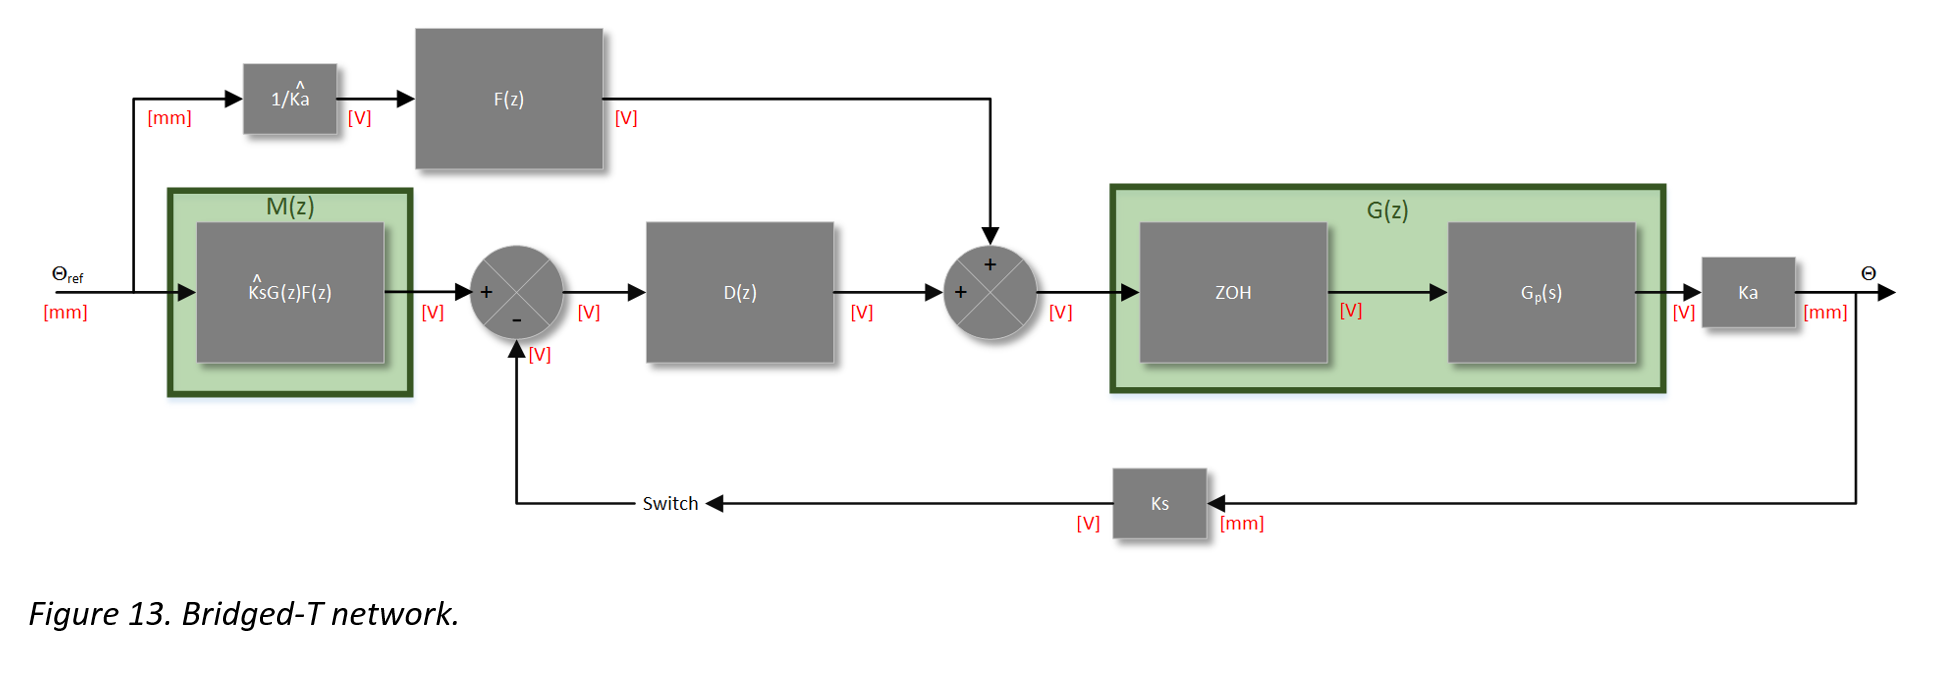
The Bridged-T network is a style of compensation that utilizes the two previous methods of control in a way that harnesses the benefits of both methods. The idea is that the open loop controller will be used to “throw” the system to the desired location when a step response is seen at the input, and the lead compensator will take control only when there is an error signal present. In essence, the open loop controller does the heavy lifting and the lead compensator does the fine tuning once the system is in the ball-parked location. This style of control achieves better performance and accuracy than what could have been possibly using a traditional PID controller.

18_ctrlsPt2

It can be seen in the diagram above that there are a few new elements introduced to the control scheme. There is a block M(z) and a feed forward path that contains the open loop controller. Additionally, there is a second summing junction after the lead compensator D(z). If there is no error signal present from the first summing junction, D(z) is effectively removed from the system (it has no effect), and the system will behave in a way such that its only form of control is coming from the open loop controller F(z).

If an error signal is present, it will be the result of the sensed position subtracted from (Ks)G(z)F(z). It is at this point in which the phase lead controller D(z) will correct any error in the system and provide disturbance rejection.

F(z) and D(z) are described by Equation 3 and Equation 5 respectively.

M(z) is described by the following transfer function

19_ctrlsPt2

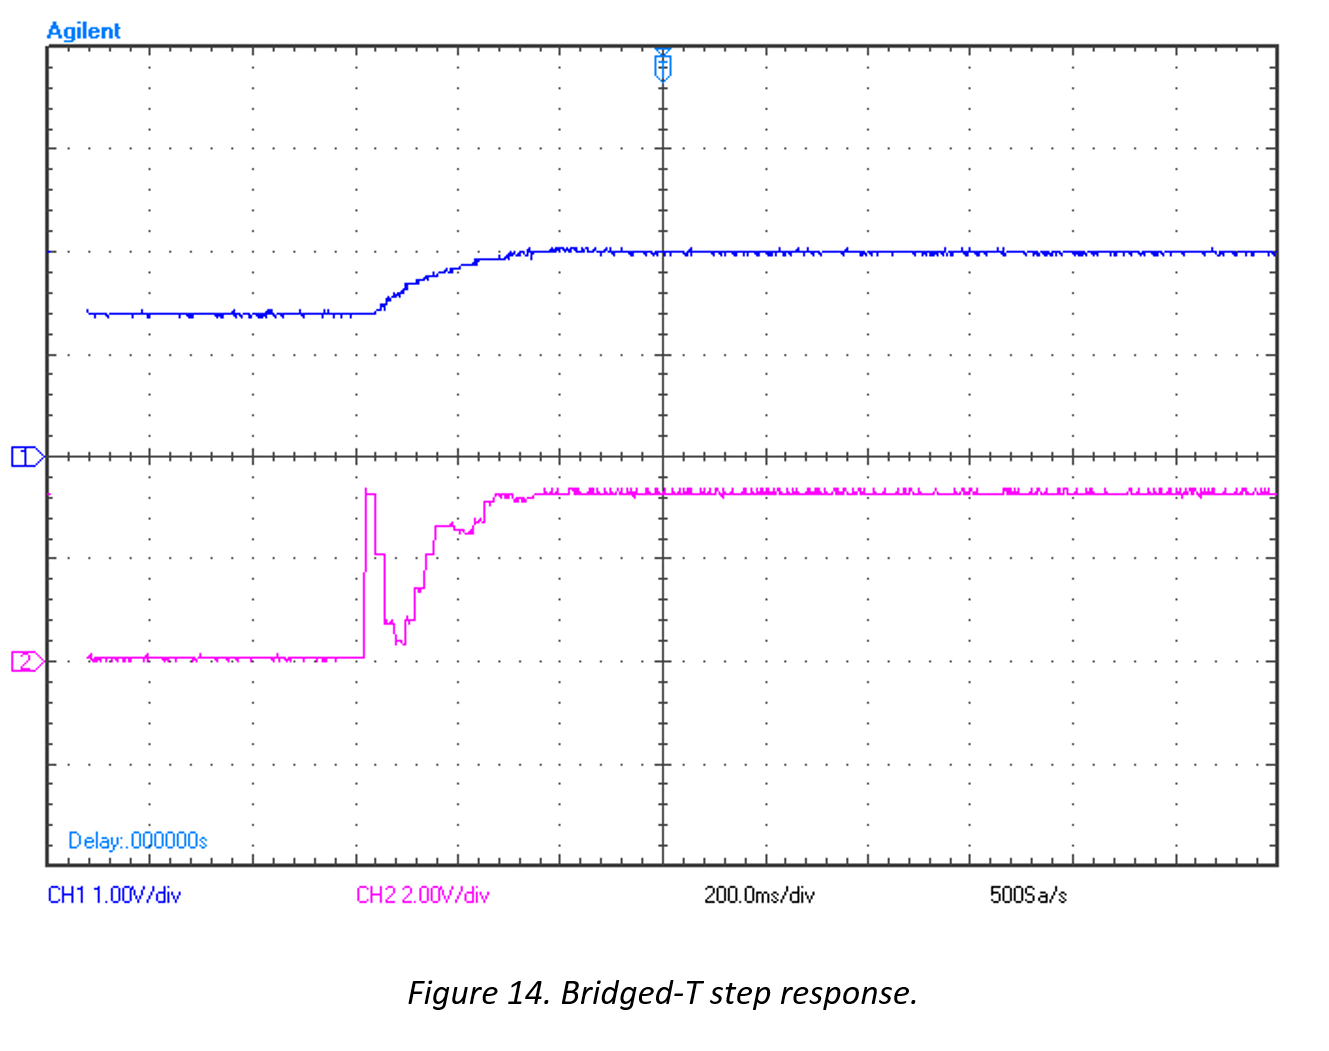
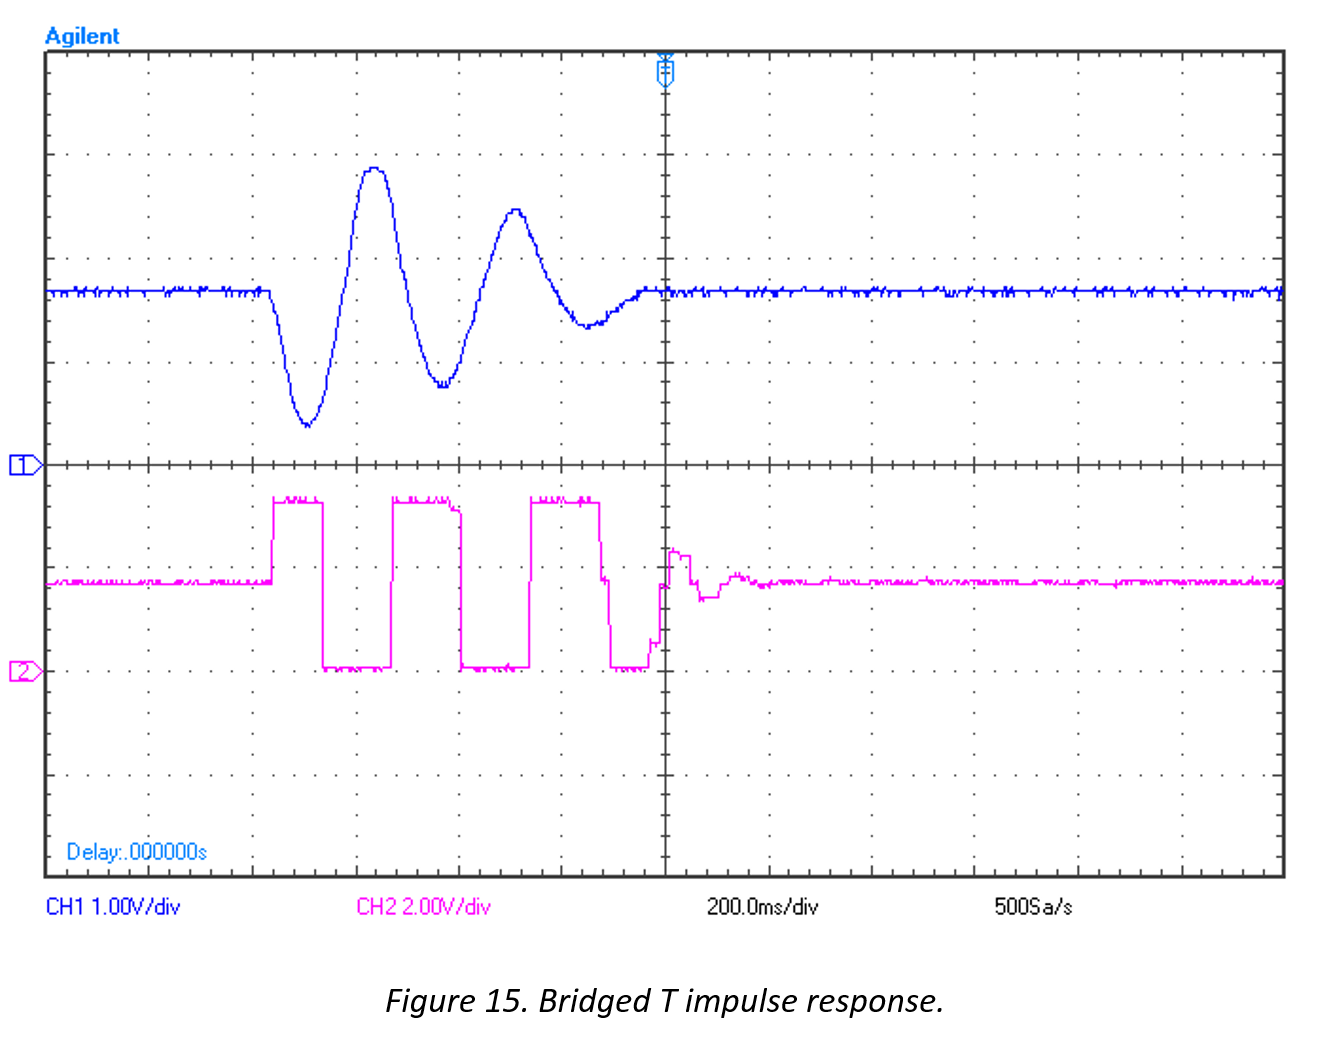
The following plots show the impulse and step response of the Bridged-T controlled system.

20_ctrlsPt2

21_ctrlsPt2

Note that the blue illustrates the system output and the pink illustrates the DAC output to the actuators.

Figure 14 shows improved transient and steady state error characteristics over the system which was previously controlled by only the lead compensator (Figure 11).

Figure 15 shows the system’s ability to still reject impulse disturbances. The system performs even better given (a settling time of approximately 600 ms, improvement factor of 20). This could be due to the fact that the control scheme was implemented in C code on an ARM Cortex M4 processor rather than with LabVIEW on the Agilent ADC/DAC tool.

Conclusion

After the teeter-totter was constructed, a model was derived by observation and applied to the prototypical second order system transfer function. This s-domain transfer function was brought into the z-domain by means of the z transform, only after the data acquisition characteristics had been corrected for by combining the zeroth order hold with the plant transfer function.

The first form of control that was examined was open loop control which provided the system with the ability to adjust to a reference point with little overshoot or steady state error, if any at all. The open loop controller was easy and quick to implement by examining where the undesired poles were located, “cancelling” them out, and introducing poles in locations that achieved the desired response.

The next form of control implemented was a form of feedback control known as phase lead compensation. The phase lead compensator consists of one pole and one zero such that the pole is less than the zero. Phase lead compensation was used not just to achieve stability, but to introduce a phase margin of nearly 65°. While the system was able to reject disturbances with a reasonable settling time, it lacked the DC gain and low steady state error of the open loop controller.

To get the best of both worlds, a “Bridged-T” compensator was implemented. This network combines the desired control effects exhibited by the two previous forms of control, one making up for what the other lacks. The open loop controller was used to “throw” the system to the desired location when a step response is seen at the input, and the lead compensator will take control only when there is an error signal present. In essence, the open loop controller was doing the heavy lifting and the lead compensator was fine tuning the system it was in the ball-parked location set by the open loop controller.

Out of my own curiosity, I implemented the Bridged-T controller in C code on an ARM Cortex-M4 to exercise the implementation of digital control systems on a microcontroller. The ARM Cortex-M4 proved to outperform the NI Data Acquisition tool. It decreased the settling by a factor of 20, up from the previous factor of 8 seen in the phase lead compensator.

Teeter Totter Pt. 1 (Construction & Characterization)

This is part one of a two part series… check out the implementation of various control schemes in part two!

Buy me a coffee!Buy me a coffee!

Abstract – A teeter totter will be constructed for the purpose of a sampled data control system demonstration. Upon completion of construction, the teeter totter and its sensor and actuator systems will be characterized to obtain a prototypical second order system transfer function. This model will then be used to design a controller and compensator for the system.

teeter

Construction 

For this exercise, the system will be a teeter totter. It is of interest to construct a system that exhibits as little amount of non-linearities as possible. The goal is to characterize its response and develop a control system that will decrease the teeter totter’s settling time by a factor of 10. The teeter totter will consist of four main parts:

  1. A plane which is free to move about an axis with one degree of freedom
  2. A post to hold the axle and elevate the plane
  3. A base to secure the post and actuators
  4. A system of sensors to allow for position information of the plane’s angle

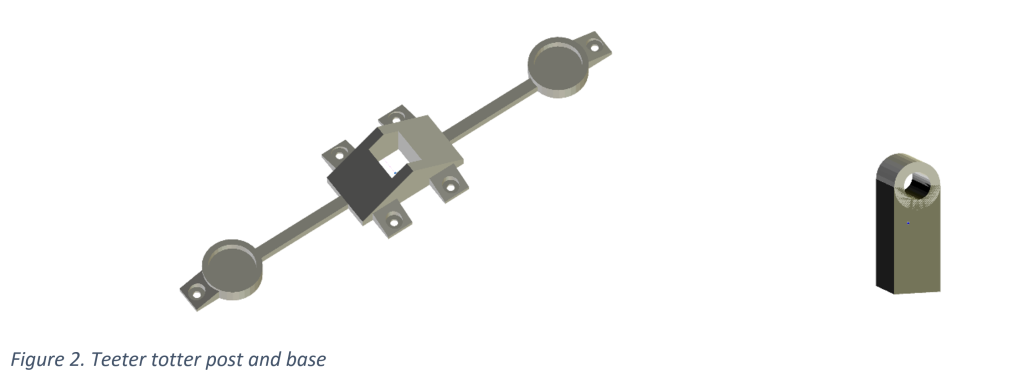
The following images are of the 3D models that were created using Blender to generate parts 1, 2, and 3 by means of 3D printing.

teeter_fig1

teeter_fig2

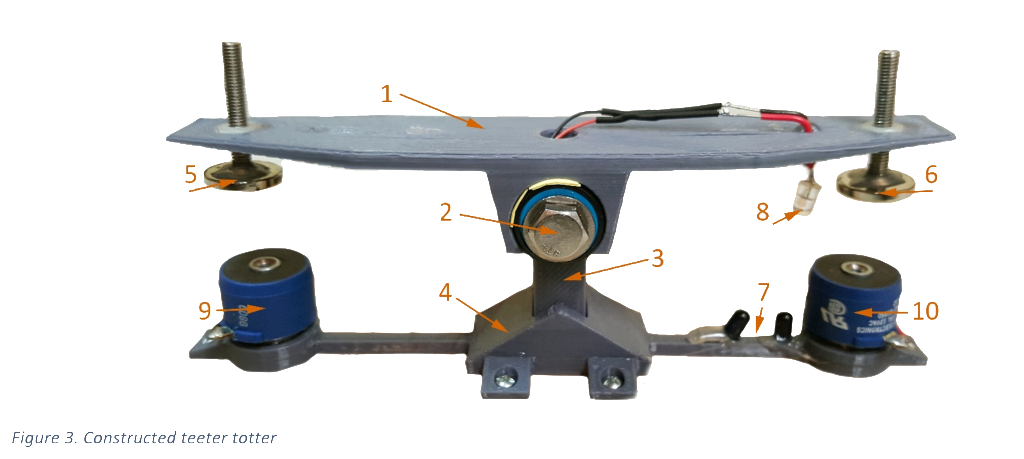
The final constructed teeter totter can be seen in the following image with annotated points of interest:

teeter_fig3fixed

teeter_table1

The plane (1) has one degree of freedom of which it is free to rotate about the axis established by its axle (2). Skateboard ABEC-5 bearings are held in place by a hex bolt, two washers, and a nut. The bearings allow for a reduction of friction which will improve linearity. The axle post (3) attaches the plane and bearing assembly to the base (4). The permanent donut magnets (5, 6) are glued to a bolt which allows for fine elevation adjustments to be made. The sensor network is comprised of two infrared emitters (7) and a single infrared photo-diode (8). The sensor network was chosen to operate in the infrared spectrum so that the system would be impervious to ambient light. The actuator network is comprised of two electromagnets (9, 10) which operate together in an opposing fashion. Their magnetic fields will repel and attract the permanent magnets (5, 6) to actuate the plane.

The sensor network provides feedback to a controller which will then deliver control signals to the actuators. The infrared photo-diode will pass a current that is proportional to the amount of infrared light being received. This current is then converted to a voltage by passing it through a resistor to ground. The voltage is then correlated to the position of the plane.

The actuator network is wired in series. Its input comes from a push-pull network of complementary transistors. A current can be delivered to the base of the NPN/PNP transistor push-pull network by the controller, causing a current to flow in the desired direction through the coils in order to achieve the appropriate magnetic field orientation.

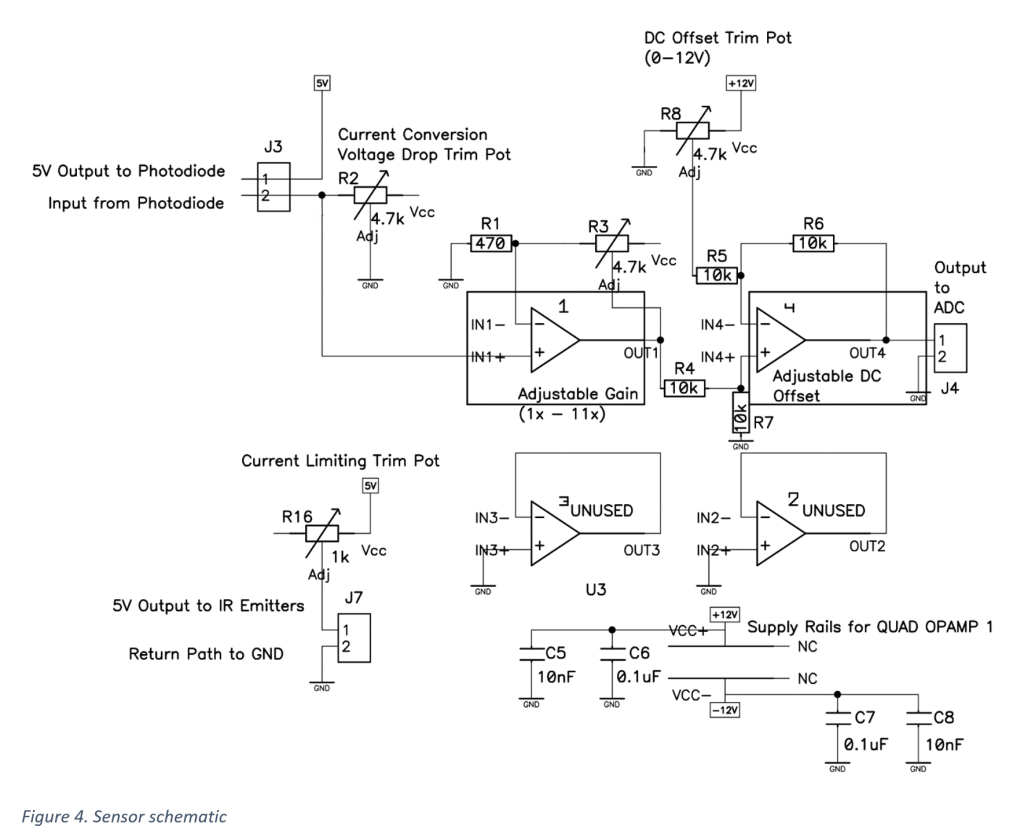
The following schematic describes the electrical setup of the sensors, actuators, ADC output and DAC input:

teeter_sch1

The connector (J3, J7) delivers power to the sensor network and converts the current to a voltage using an adjustable potentiometer. This voltage is then sent through a gain stage and an offset stage for conditioning to the ADC.

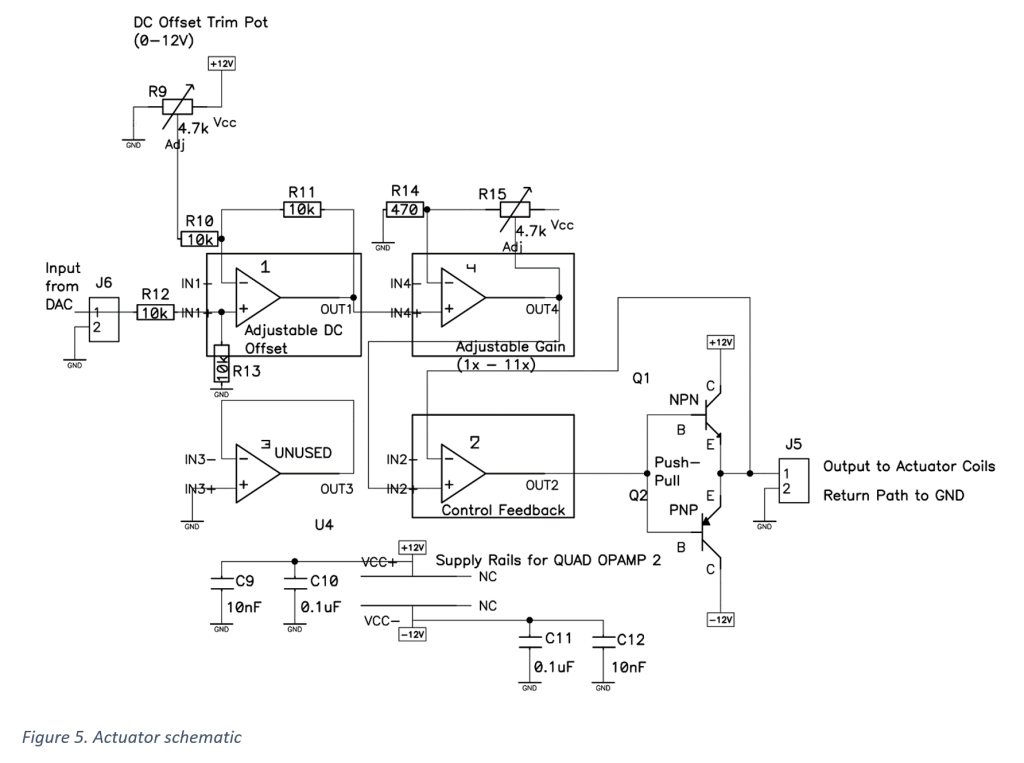
The actuator network (seen in Figure 5) works in a similar fashion, where the input form the DAC (J6) is conditioned by an offset stage and gain stage in order to deliver +/- 12V to the actuator coils.

teeter_sch2

A prototype was created which can be described by the previous schematics in Figures 4 and 5 (excluding voltage regulators) in addition to a printed circuit board.

teeter_fig6

Modeling

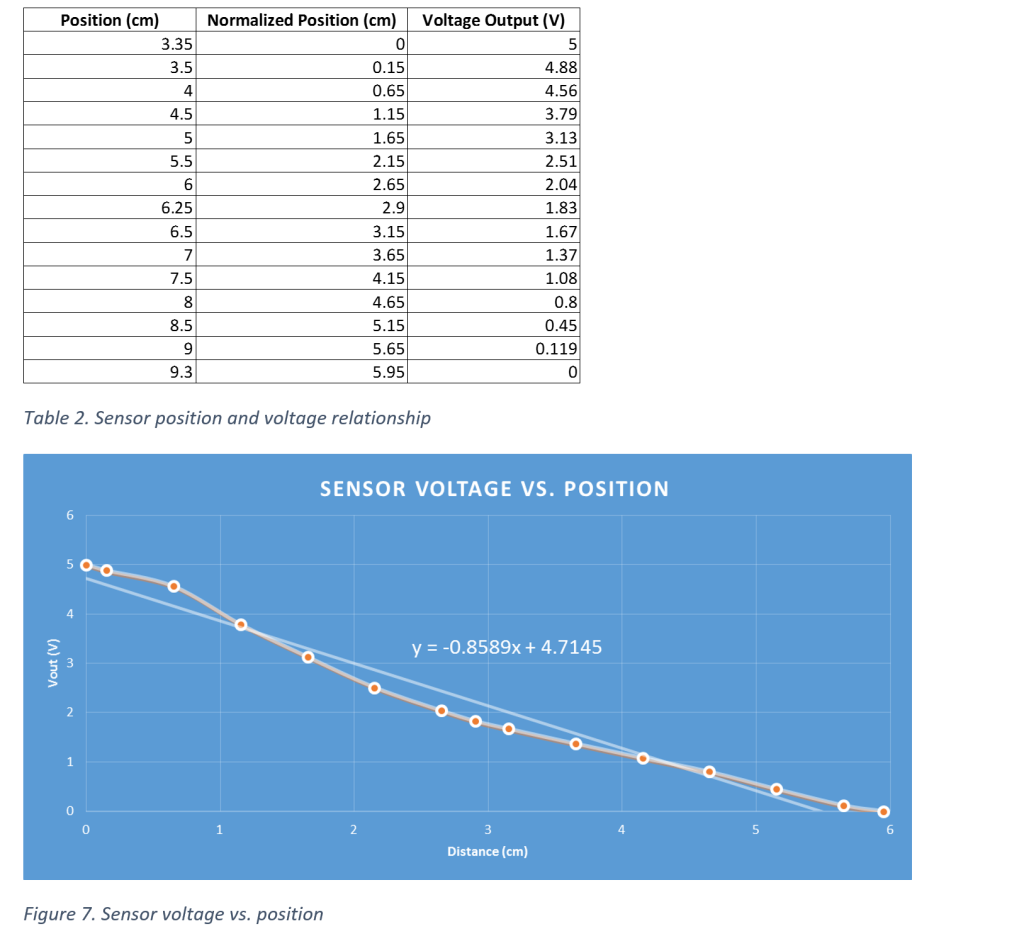
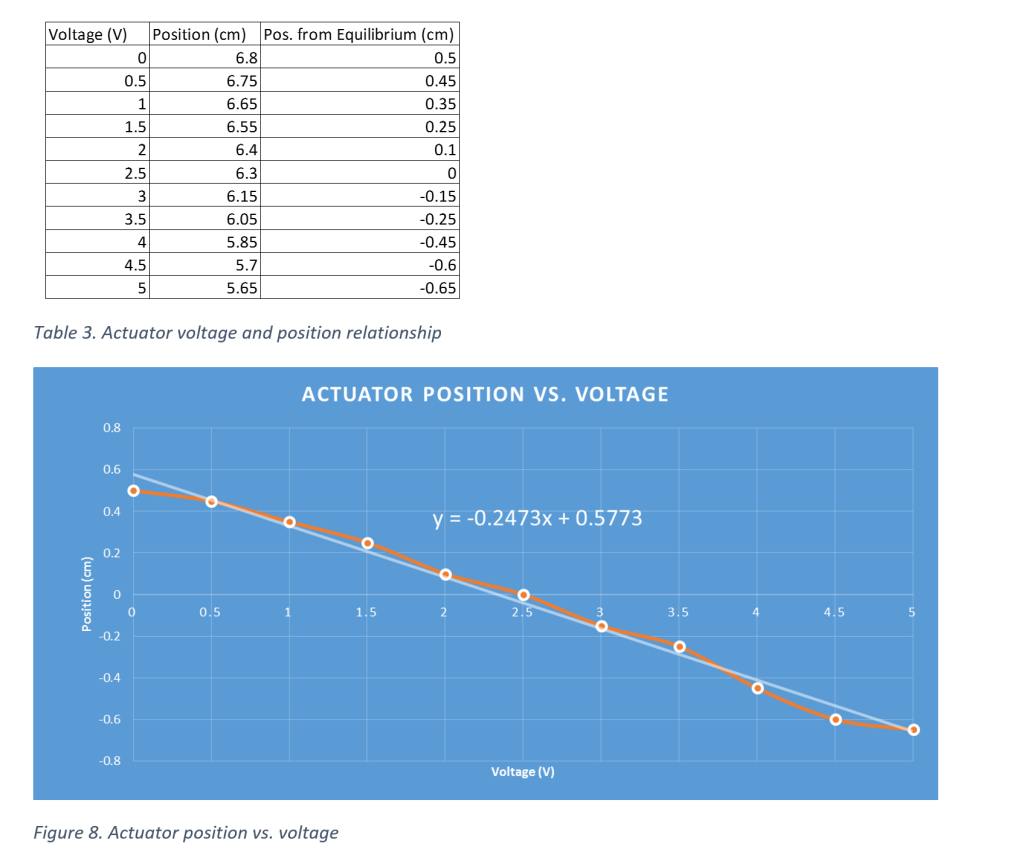
The sensor and actuator network was characterized in the following fashion: For the sensors, the plane of the teeter totter was manually positioned at various points and the corresponding output voltage was noted. For the actuators, an input voltage was delivered from -12 to +12 volts and the position of the teeter totter plane was noted. The results have been tabulated and can be seen in the following tables and plots.

teeter_fig7table2

teeter_fig8table3

From the results above, the data points have been characterized by the following linear equations

Sensors:

teeter_eqn1

Actuators:

teeter_eqn2

The absolute value of the slope from Equation 1 represents the sensor gain, Ks, and the absolute value of the slope from Equation 2 represents the actuator gain, Ka.

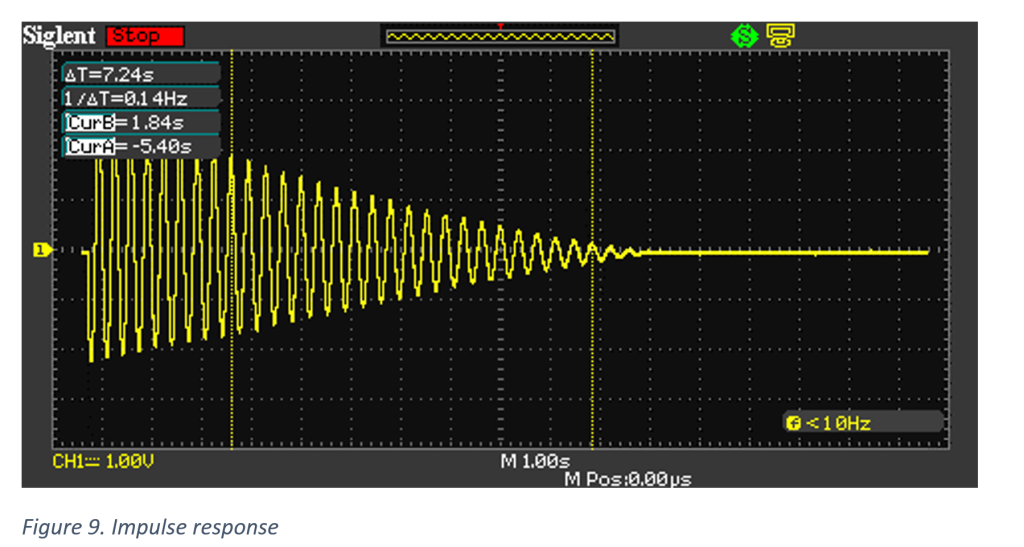
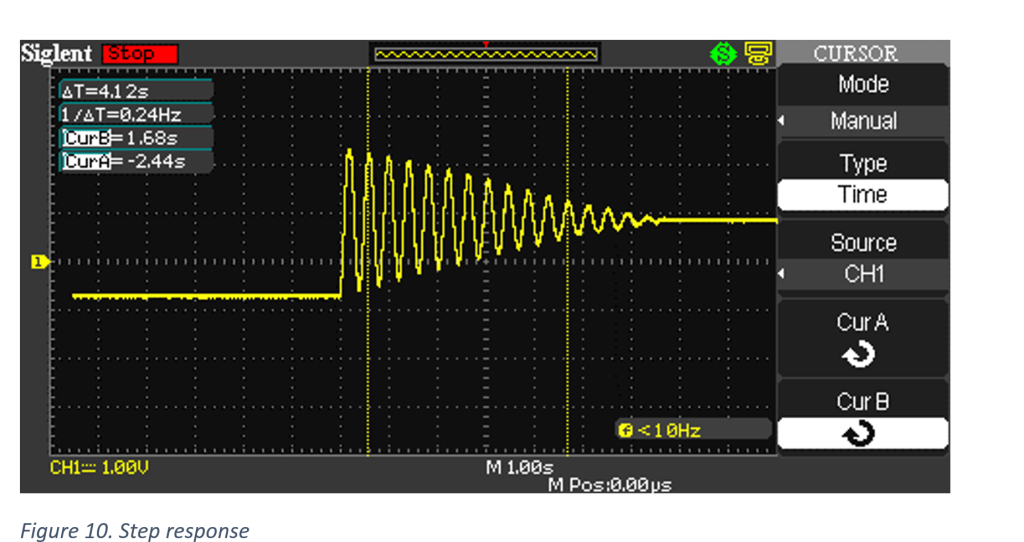
The system was then connected to an oscilloscope and power supply in order to obtain the impulse and step responses. The output voltages are obtained from the infrared sensors. They relate the position of the teeter totter’s plane to a voltage.

teeter_fig9

teeter_fig10

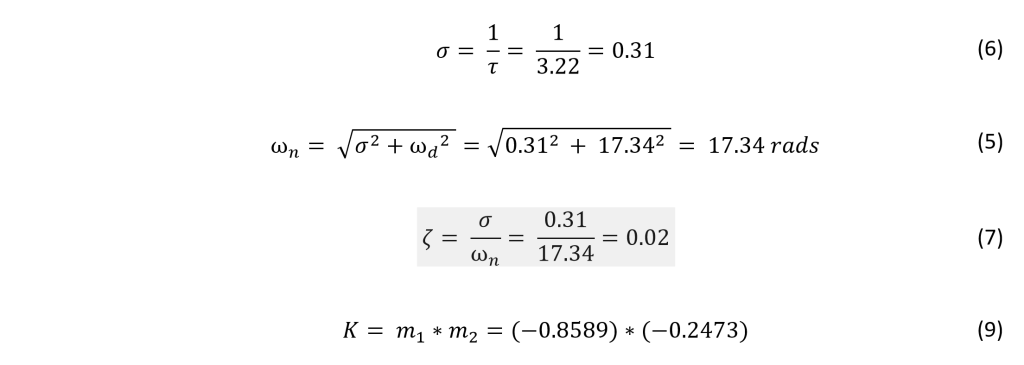
From Figure 9, twenty periods were used to find the average values of the period (T), damped frequency (ω­­­d), natural frequency (ωn), time constant (τ), damping coefficient (σ), and damping ratio (ζ).

The following calculations are with regard to the impulse response:

teeter_eqn3-5

teeter_eqn6-9

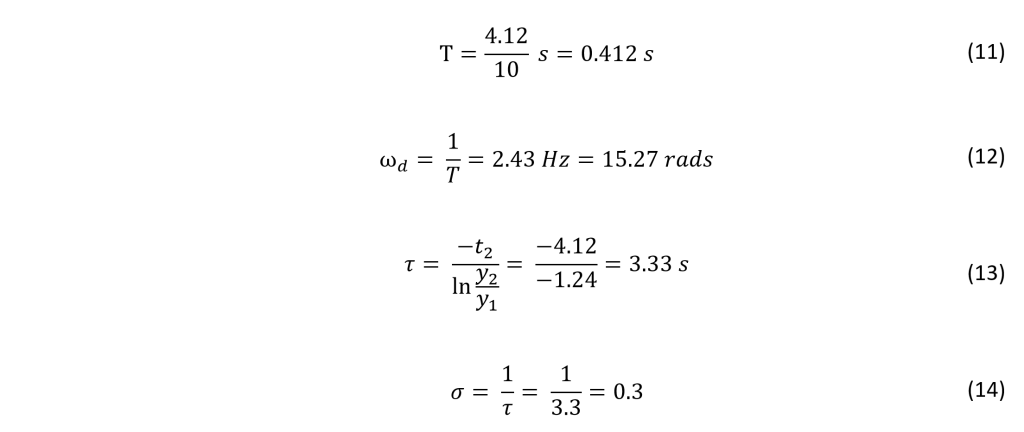
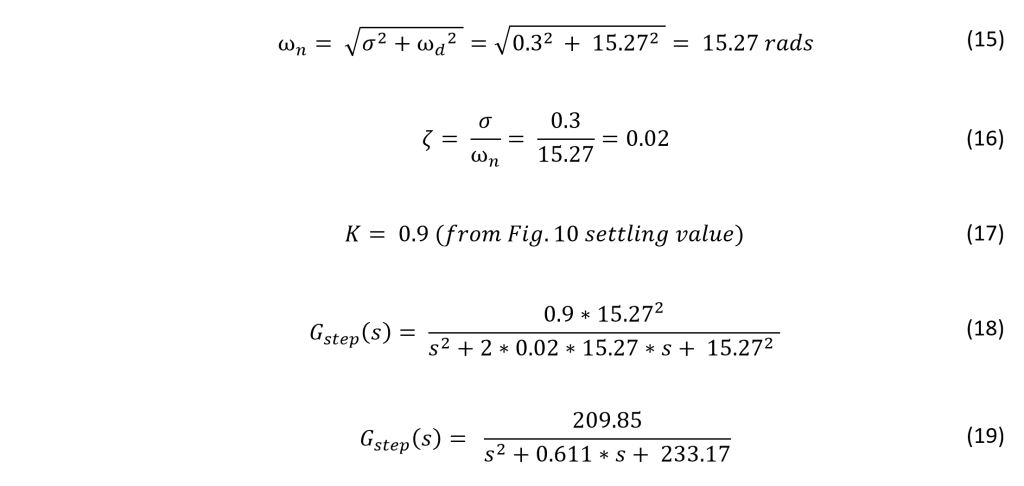
The transfer function can now be constructed from the obtained values. The prototypical transfer function for a second order system is

teeter_eqn8-10

In a similar fashion, the transfer function can be obtained using the step response:

teeter_eqn11-14

teeter_eqn15-19

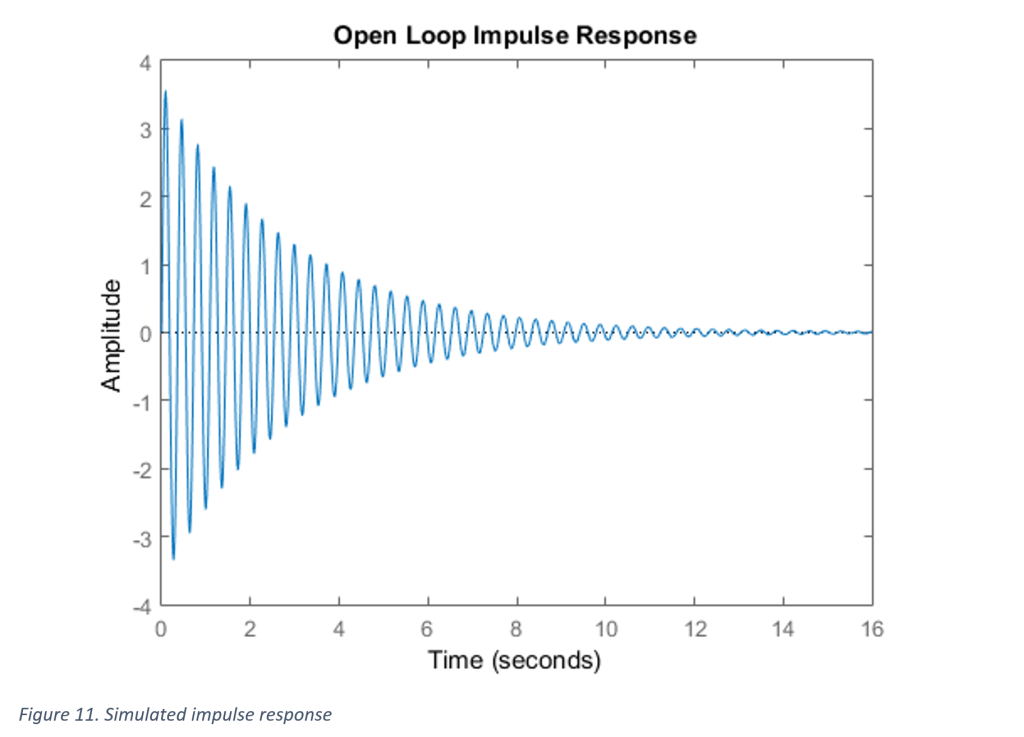
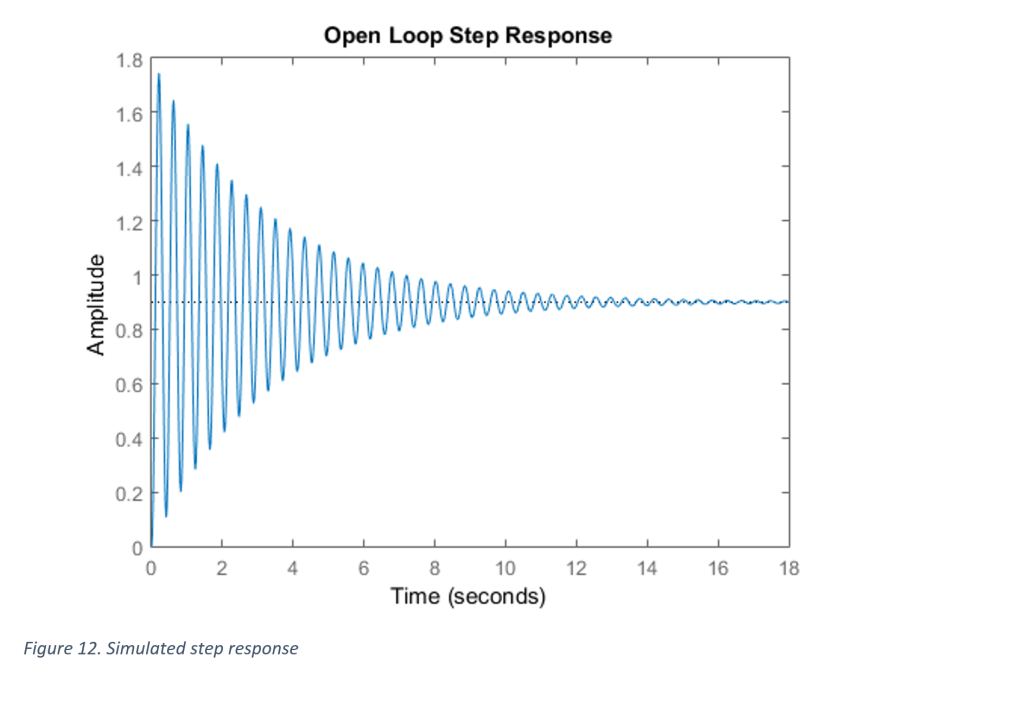
The transfer function obtained from the step and impulse response can now be plotted using Matlab:

teeter_fig11

teeter_fig12

Conclusion

The teeter totter constructed is suitable for a sampled data control system demonstration. While in its current state it still exhibits some nonlinear characteristics, it should be sufficient for moving forward to the next phase. The system can continue to be improved upon as a controller and compensator is being developed for it.

The next step is to develop a discrete model for what is currently a continuous time model. Once this is achieved, a microprocessor will be able to read in sensor data through an analog-to-digital converter, make control decisions based on the control scheme and sampled data, and output the appropriate control signals through a digital-to-analog converter.

This is part one of a two part series… check out the implementation of various control schemes in part two!

TIG Pulse Welding with Due

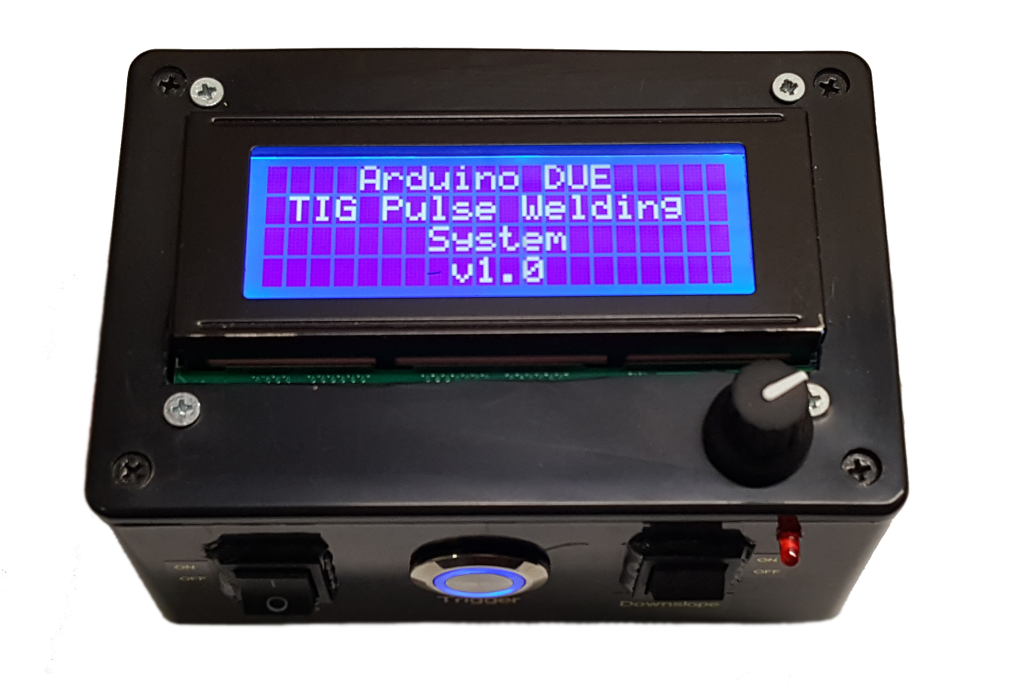
Here is a project that utilizes the 12-bit DAC on the Arduino Due to deliver open-loop control signals to a TIG welder. A DC TIG welder will normally deliver a constant current arc, but by hi-jacking the foot pedal input, a pulse frequency can be set and the arc can switch between a peak and background current.

Pulsing the TIG arc is beneficial cosmetically and will reduce the amount of heat input.

pulseWelding_cropped

Code

Schematic, documentation, and demo to come…