Bandpass Filter Design using Geffe's Algorithm
AnalogPython tool for automated analog bandpass filter design using Geffe's algorithm and Delyiannis-Friend op-amp circuits. Generates component values and Bode plots.
Introduction
Analog filter design can be a tedious task, requiring frequency transformations, pages and pages of algebra, and many simulations to check that you are getting the response you designed for. Through the use of Geffe’s algorithm and Delyiannis-Friend circuits, bandpass filter design can be partially automated.
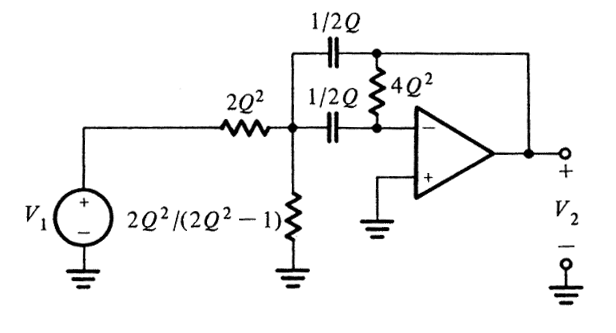
Delyiannis-Friend op-amp circuit schematic with unity gain configuration [1]:
The purpose of this post isn’t to detail the specifics behind Geffe’s algorithm, but rather to share with you a python script I wrote that will apply Geffe’s algorithm to a given set of input parameters, and output the required component values for each Friend circuit.
It is required that you have Python3 along with numpy, matplotlib, and scipy installed on your machine. The script can be executed through the Powershell if you are a Windows user by navigating to the directory where the Geffe_Friend_Bandpass.py file is located and then typing: python .\Geffe_Friend_Bandpass.py
Entering Input Parameters
Upon execution, the python script will prompt you for some input parameters.
You are first asked for the maximum attenuation in the stop bands and the minimum attenuation in the pass band.
Then, you are asked to specify the pass band frequencies (f1 and f2) and one of the stop band frequencies (f3 or f4). The other stop band frequency is solved for automatically. See the following image [1]:

PS C:\Users\Zack\Desktop> python .\Geffe_Friend_Bandpass.py

Let's design a butterworth bandpass filter using Geffe's algorithm and Friend Circuits...

Enter the minimum attenuation (in dB) in the stop band (a_min): 20
Enter the maximum attenuation (in dB) in the pass band (a_max): 0.5

Enter f1 (the beginning of the pass band) in Hz: 20000
Enter f2 (the end of the pass band) in Hz: 40000

Do you wish to specify f3 (the end of the HPF stop band)? Enter (3).
Or f4 (the beginning of the LPF's stop band)? Enter (4).

Choose option (3) or (4): 3

Enter f3 (end of HPF's stop band) in Hz: 15000
Parameter Details
The script will then return to you the information you had just entered, along with the minimum order filter required to meet your specifications.
The bandpass filter will be designed using the following parameters:
---------------------------------------------------------------
n (minimum filter order):          6.0 (5.15)
a_min (atten. in stop band):      20.0 dB
a_max (atten. in pass band):       0.5 dB
f1 (start of pass band):       20000.0 Hz
f2 (end of pass band):         40000.0 Hz
f3 (end of HPF attenuation):   15000.0 Hz
f4 (start of LPF attenuation): 53333.3 Hz
f0 (center frequency):         28284.3 Hz
Bandwidth:                     20000.0 Hz
Q:                              116.1
---------------------------------------------------------------
Butterworth Pole Locations
The locations of the poles are returned in both polar and rectangular format.
Butterworth pole locations:
--------------------------------------------------------------
Poles begin at +/-: 15.0deg from the negative real axis.
Poles are spaced by: 30.0 deg

Pole #1:  1.19 arg 165.0deg ... (-1.15+0.31j)
Pole #2:  1.19 arg -165.0deg ... (-1.15-0.31j)

Pole #3:  1.19 arg 135.0deg ... (-0.84+0.84j)
Pole #4:  1.19 arg -135.0deg ... (-0.84-0.84j)

Pole #5:  1.19 arg 105.0deg ... (-0.31+1.15j)
Pole #6:  1.19 arg -105.0deg ... (-0.31-1.15j)

Pole #7:  1.19 arg 75.0deg ... (0.31+1.15j)
Pole #8:  1.19 arg -75.0deg ... (0.31-1.15j)

Pole #9:  1.19 arg 45.0deg ... (0.84+0.84j)
Pole #10: 1.19 arg -45.0deg ... (0.84-0.84j)

Pole #11: 1.19 arg 15.0deg ... (1.15+0.31j)
Pole #12: 1.19 arg -15.0deg ... (1.15-0.31j)
--------------------------------------------------------------
Gain Information
The gain of each stage is normalized to unity, resulting in unity gain at the center frequency.
The script can be tweaked to create a filter/amplifier, or an additional amplifier can be added after the filter.
Gain of each stage / Total gain:
-------------------------------------------------------
The gain of stage 1 would be 2.94, but has been corrected to unity.
The gain of stage 2 would be 2.94, but has been corrected to unity.
The gain of stage 3 would be 4.17, but has been corrected to unity.
The gain of stage 4 would be 4.17, but has been corrected to unity.
The gain of stage 5 would be 11.76, but has been corrected to unity.
The gain of stage 6 would be 11.76, but has been corrected to unity.

The overall gain would be: 20762.4806 or 86.3456 dB (but has been corrected to 0 dB)
-------------------------------------------------------
Required Resistor and Capacitor Values
The script will automatically calculate reasonable component values for each Friend circuit.
Note that n operational amplifiers (Friend circuits) are required for an nth order filter.
Component values:
------------------------------------------------------------
Rin_1:  7521.54
Rin_2:  3882.9
Rf_3:   15684.01

Rin_4:  5929.4
Rin_5:  3060.98
Rf_6:   12364.06

Rin_7:  9068.36
Rin_8:  2859.01
Rf_9:  26859.01

Rin_10: 4918.0
Rin_11: 1550.52
Rf_12: 14566.32

Rin_13: 9946.81
Rin_14: 924.46
Rf_15: 83044.25

Rin_16: 4483.67
Rin_17: 416.71
Rf_18: 37433.44

The capacitor value for all caps is: 1.0 nF.
------------------------------------------------------------
Click on the image to enlarge it, notice how the resistors and capacitors correspond to the output generated by the python script.

This example can be used as a general case, and the same arrangement will arise for any nth order output.
Auto Generated Bode Magnitude Plot
The script will then call on matplotlib to generate the bode magnitude plot of the filter. Interactive cursors have been added to allow for inspection of the pass and stop band frequencies.

Plotting in LT Spice (AC Sweep)
Here is the frequency response of the circuit once it had been built in LTSpice:

Conclusion
So what is this script good for? Let’s say you wanted to build a circuit that required multiple analog bandpass filters, but don’t want to crank out all the math to calculate the component values.
For example, to create an analog audio spectrum analyzer,
you would need 8-10 bandpass filters to select for various bands of the audio spectrum. You could use this script to design 8 bandpass filters very quickly!


References
[1] E., Van Valkenburg M. Analog Filter Design. New York: Holt, Rinehart, and Winston, 1982. Print.